Quark Trusted Research Environment Workshop Guide
Welcome to the Quark Trusted Research Environment (TRE) Workshop. This document will guide you step-by-step through:
- Login to the Quark TRE
- Browse Datasets
- Create a Cohort
- Request Cohort Access
- Browse Approved Cohort’s Dashboards
- Request Workstations
- Connect to Workstations
- Open JupyterLab
- Run script blocks step-by-step
- Request result files download
Step 1: Login to the Quark TRE
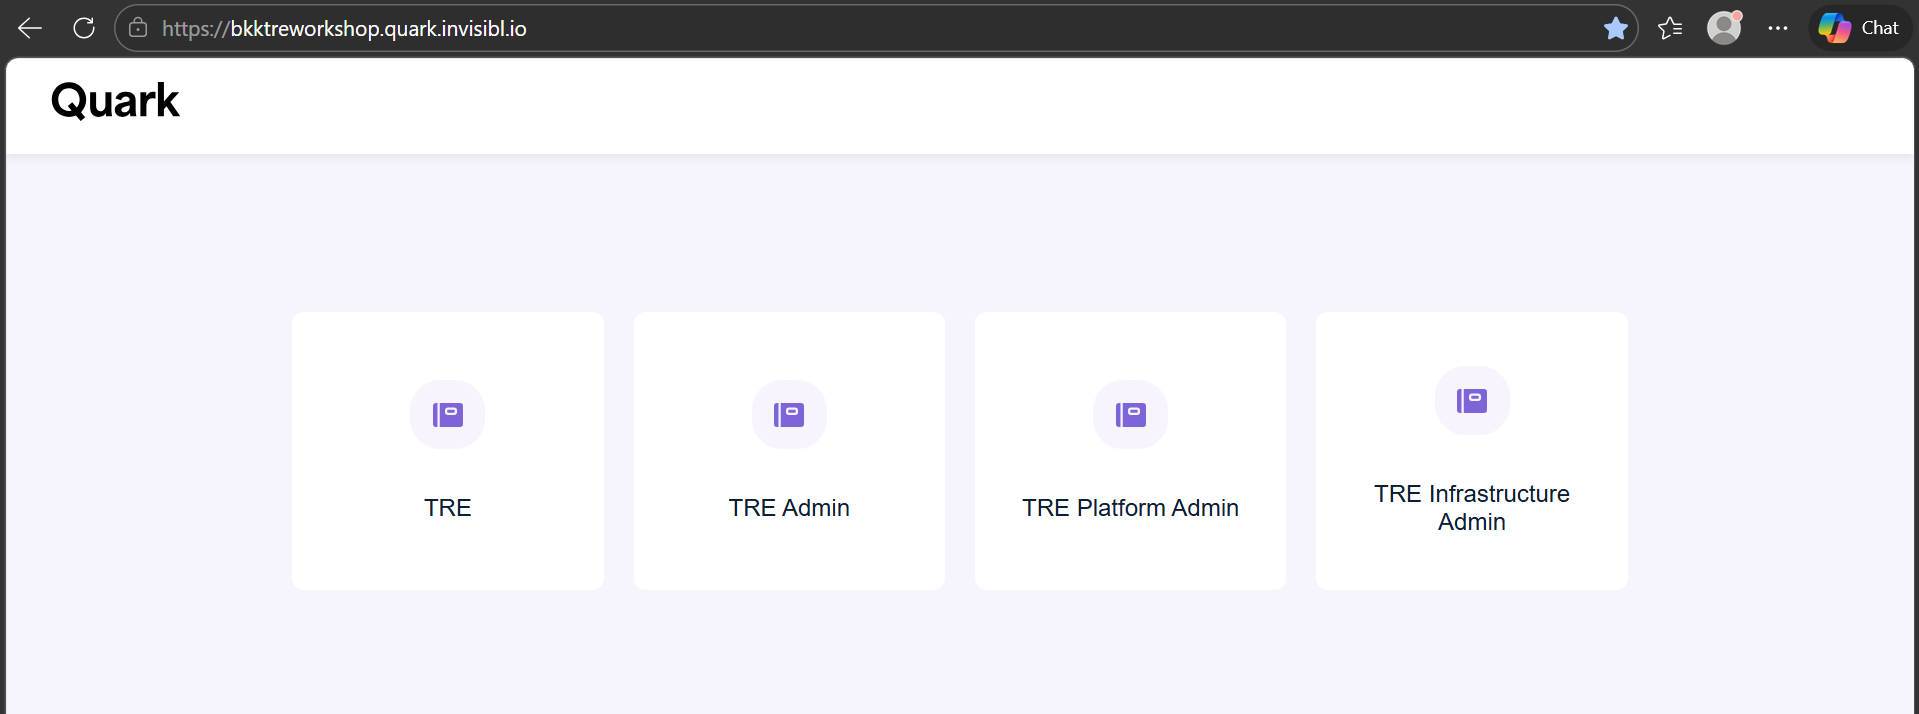
- Open https://bkktreworkshop.quark.invisibl.io/
- Click on the “TRE” icon
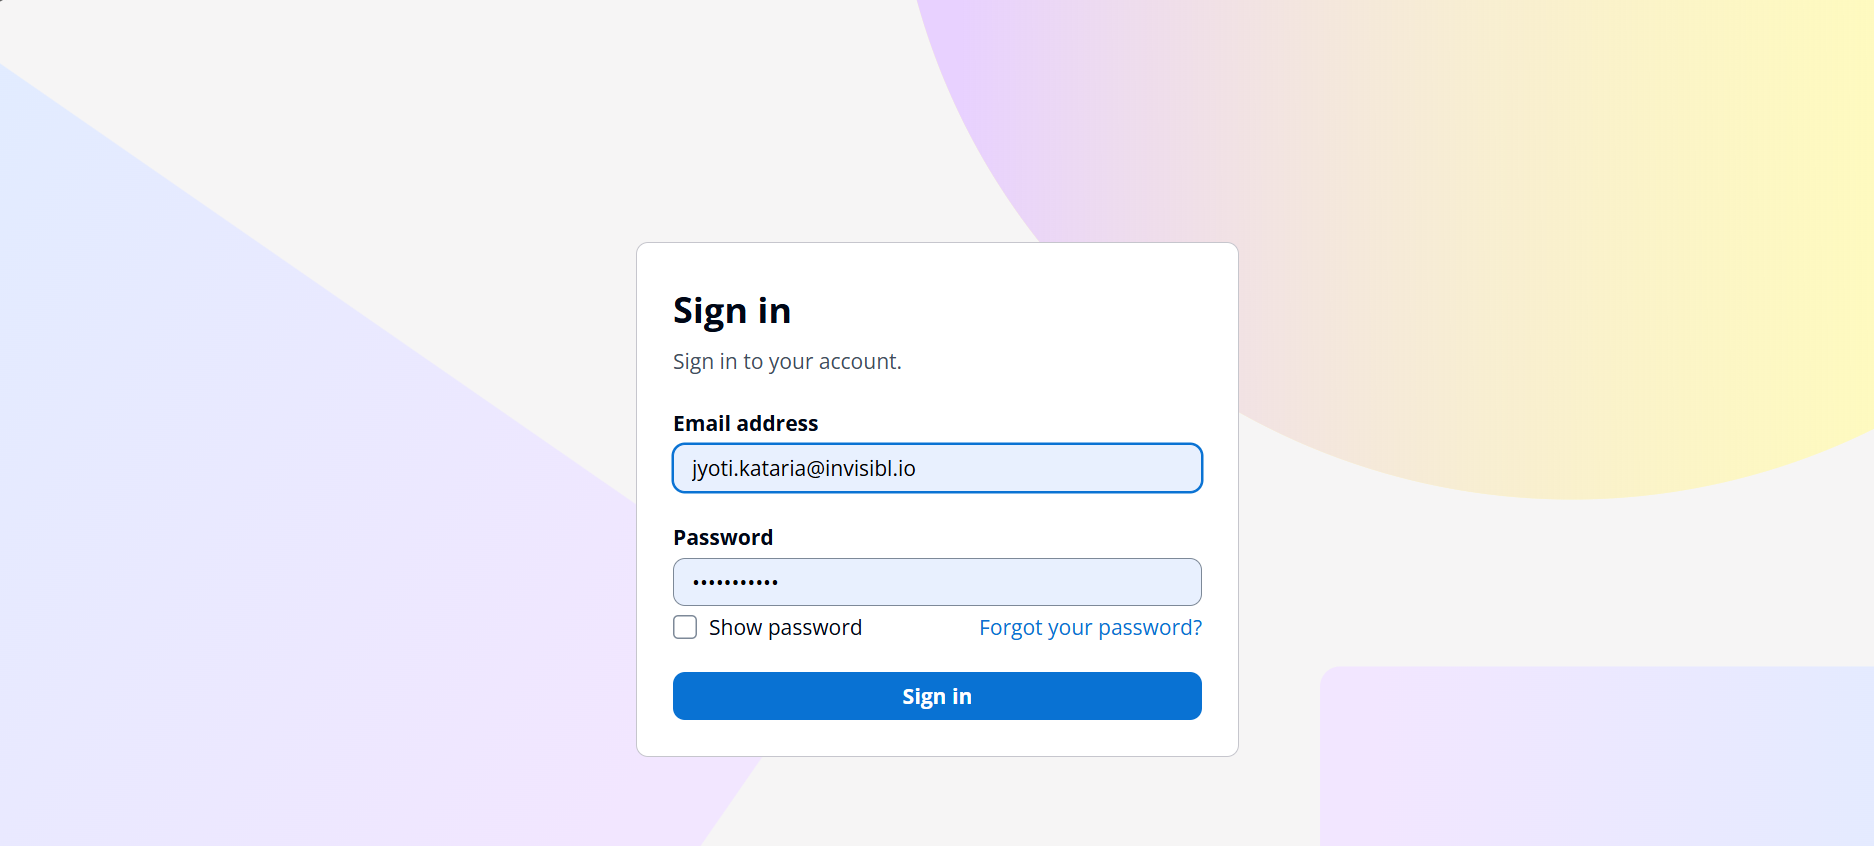
- Provide your login username and password
Step 2: Browse Catalog Datasets
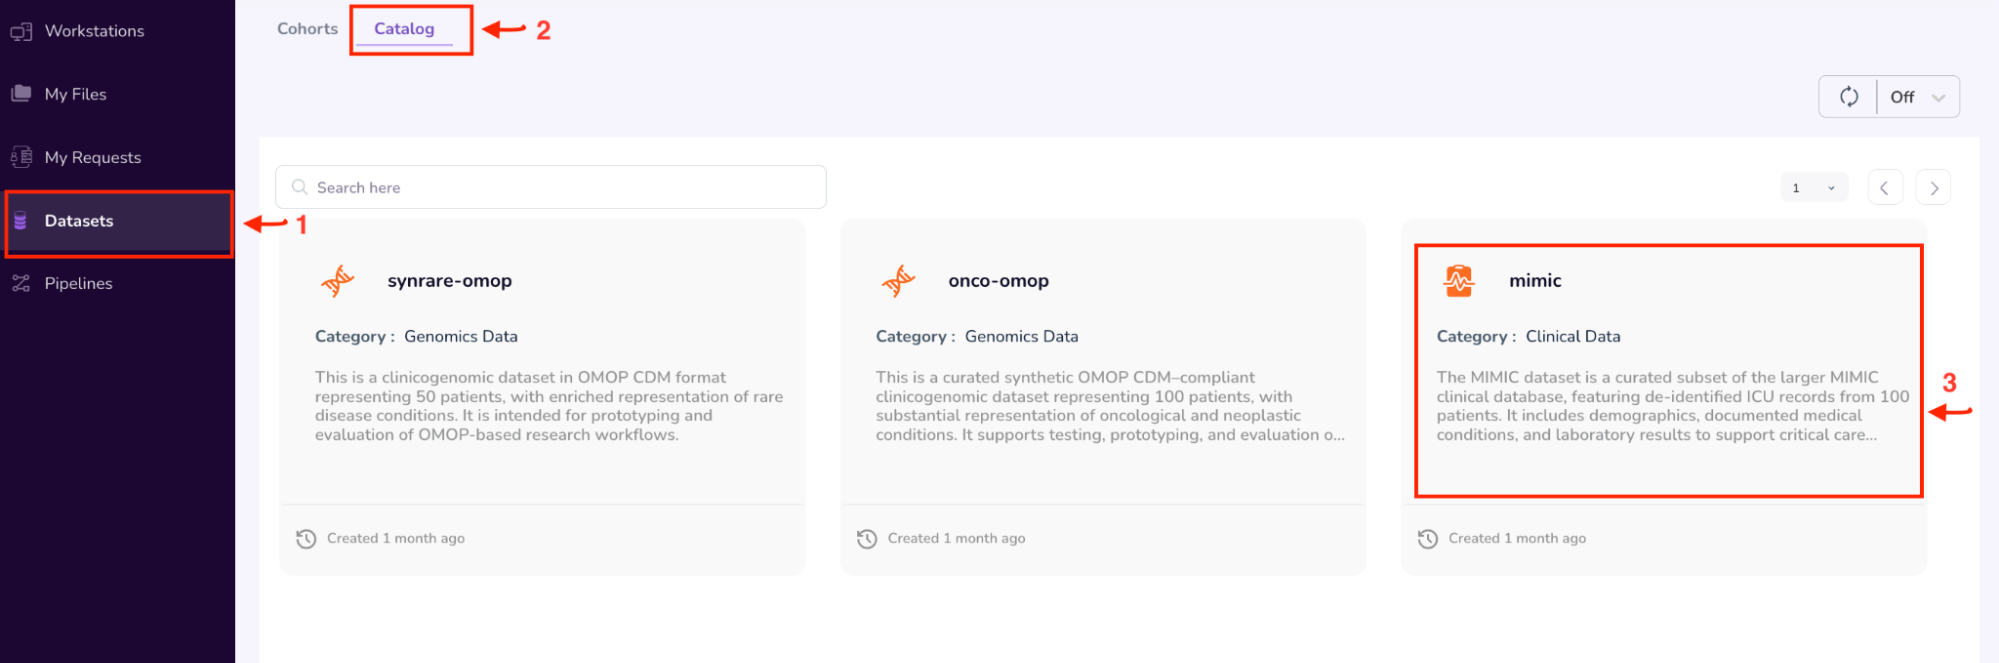
- Select “Datasets” on the left Navigation Pane
- Click on the “Catalog” tab. This window shows all the datasets available to you on the platform.
- Select the “MIMIC” dataset.
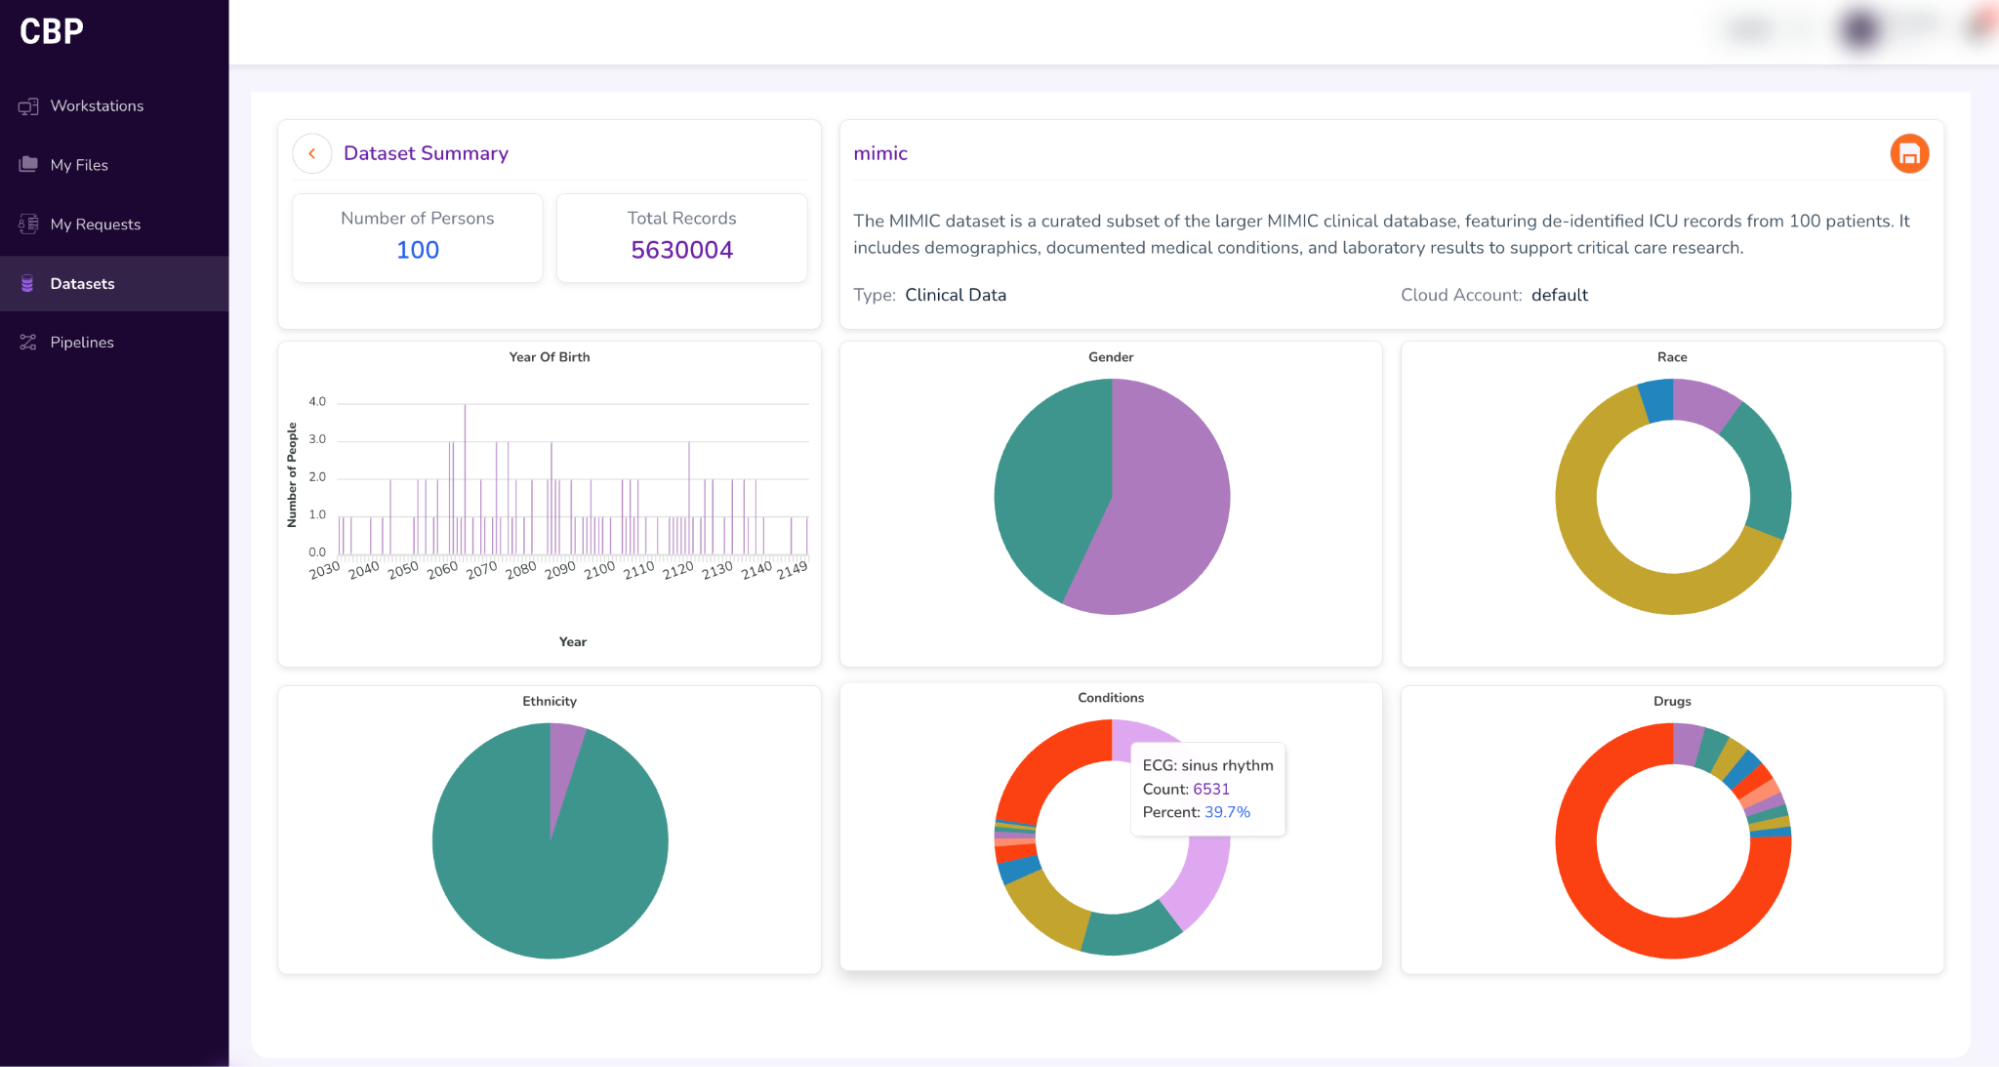
- This will open a “Dataset Summary” dashboard, as shown below.
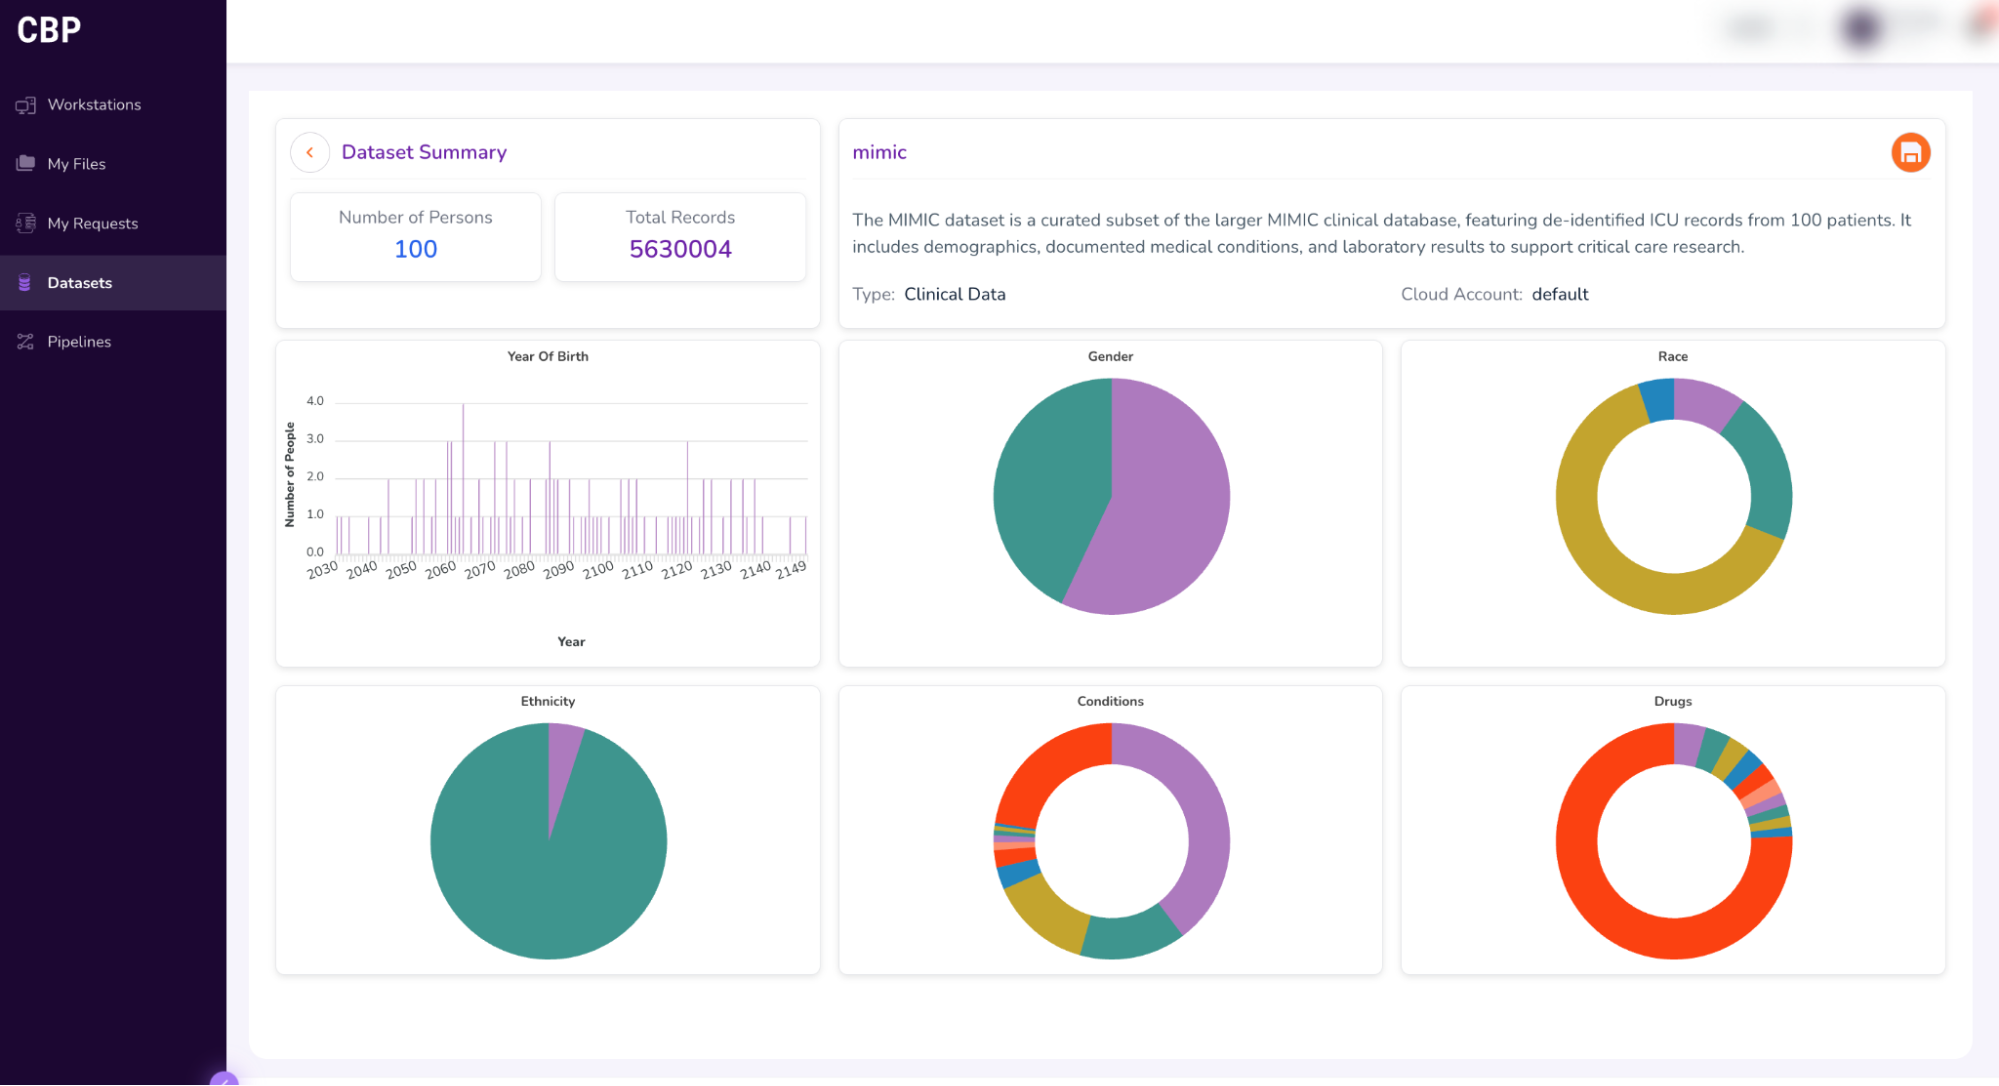
- Hover your pointer over the visualizations to view details about the dataset.
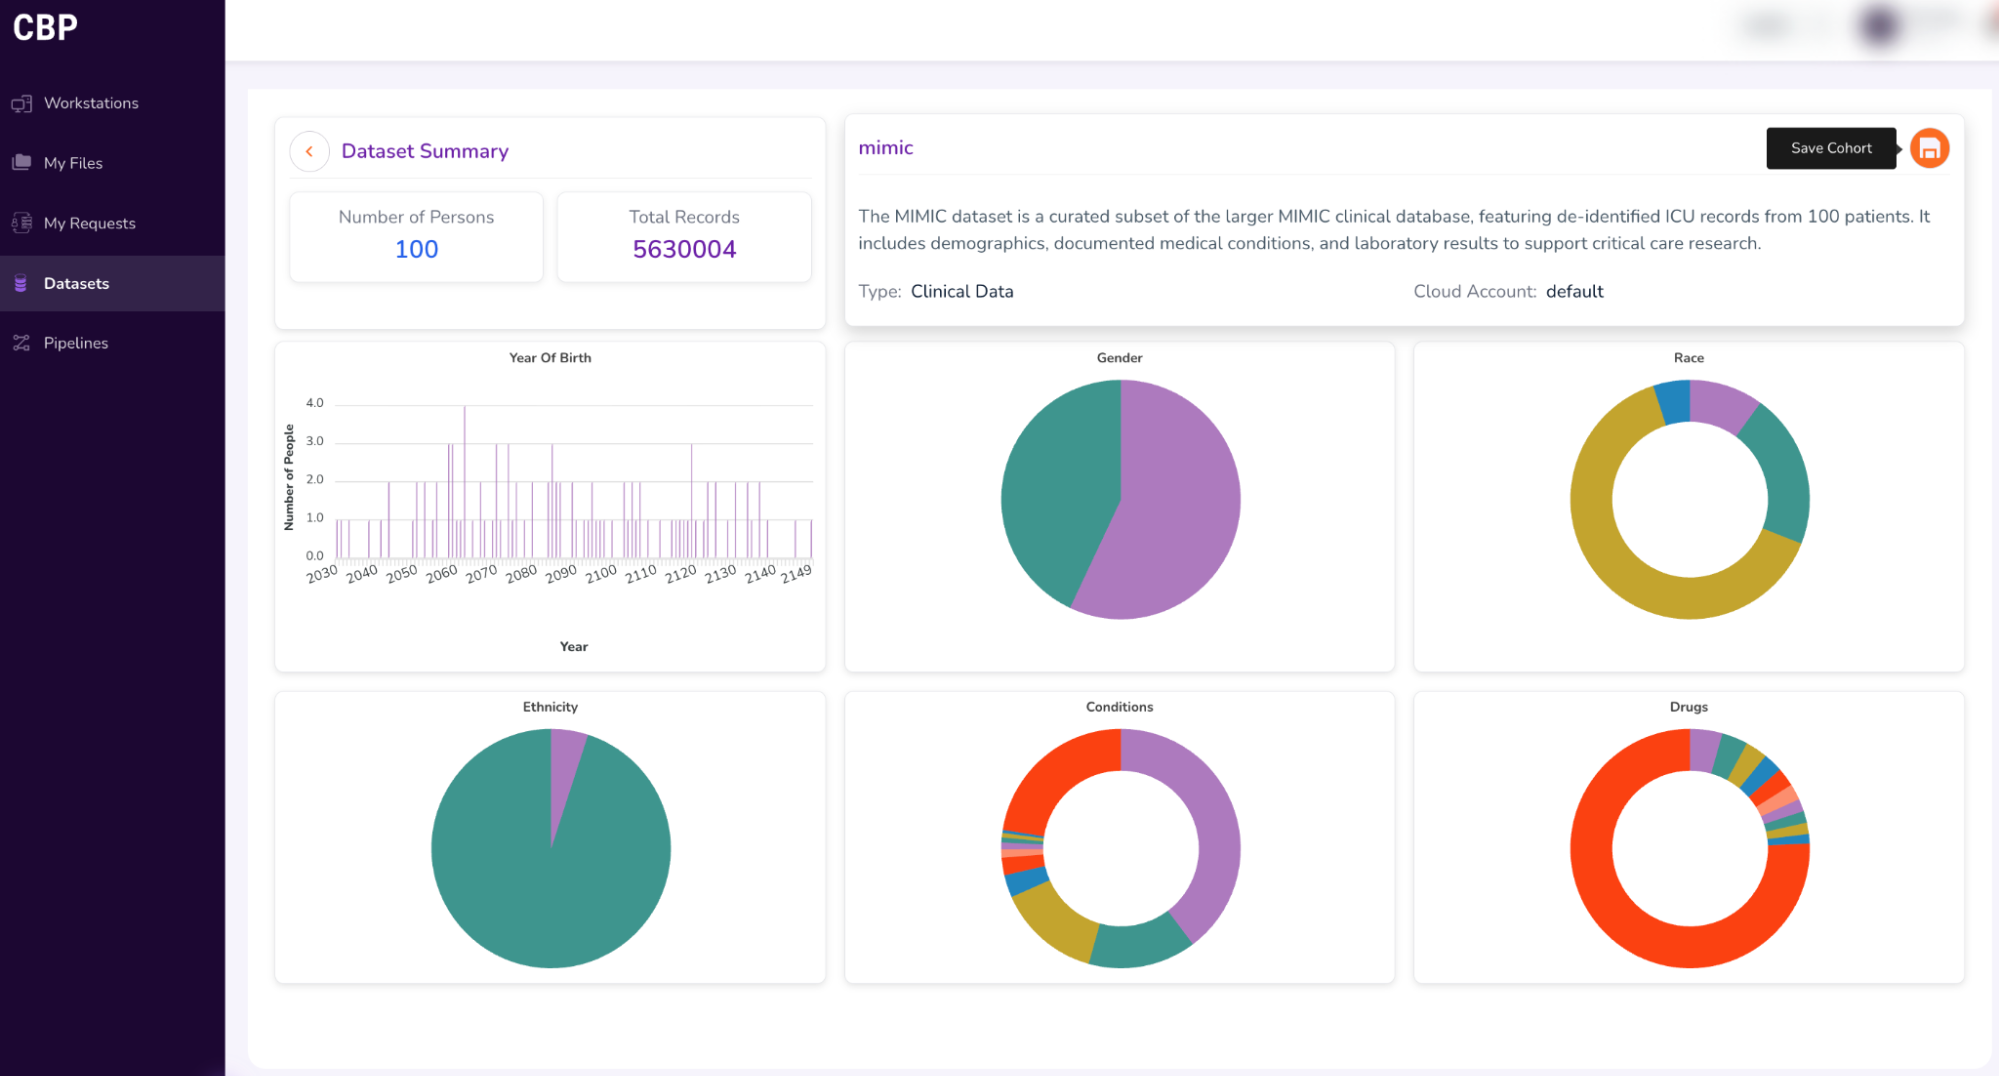
- Getting access to the entire dataset:
Select the “Save Cohort” icon on the top-right corner of the screen and fill out the form to request Full Dataset Access (as shown in the screenshots below)
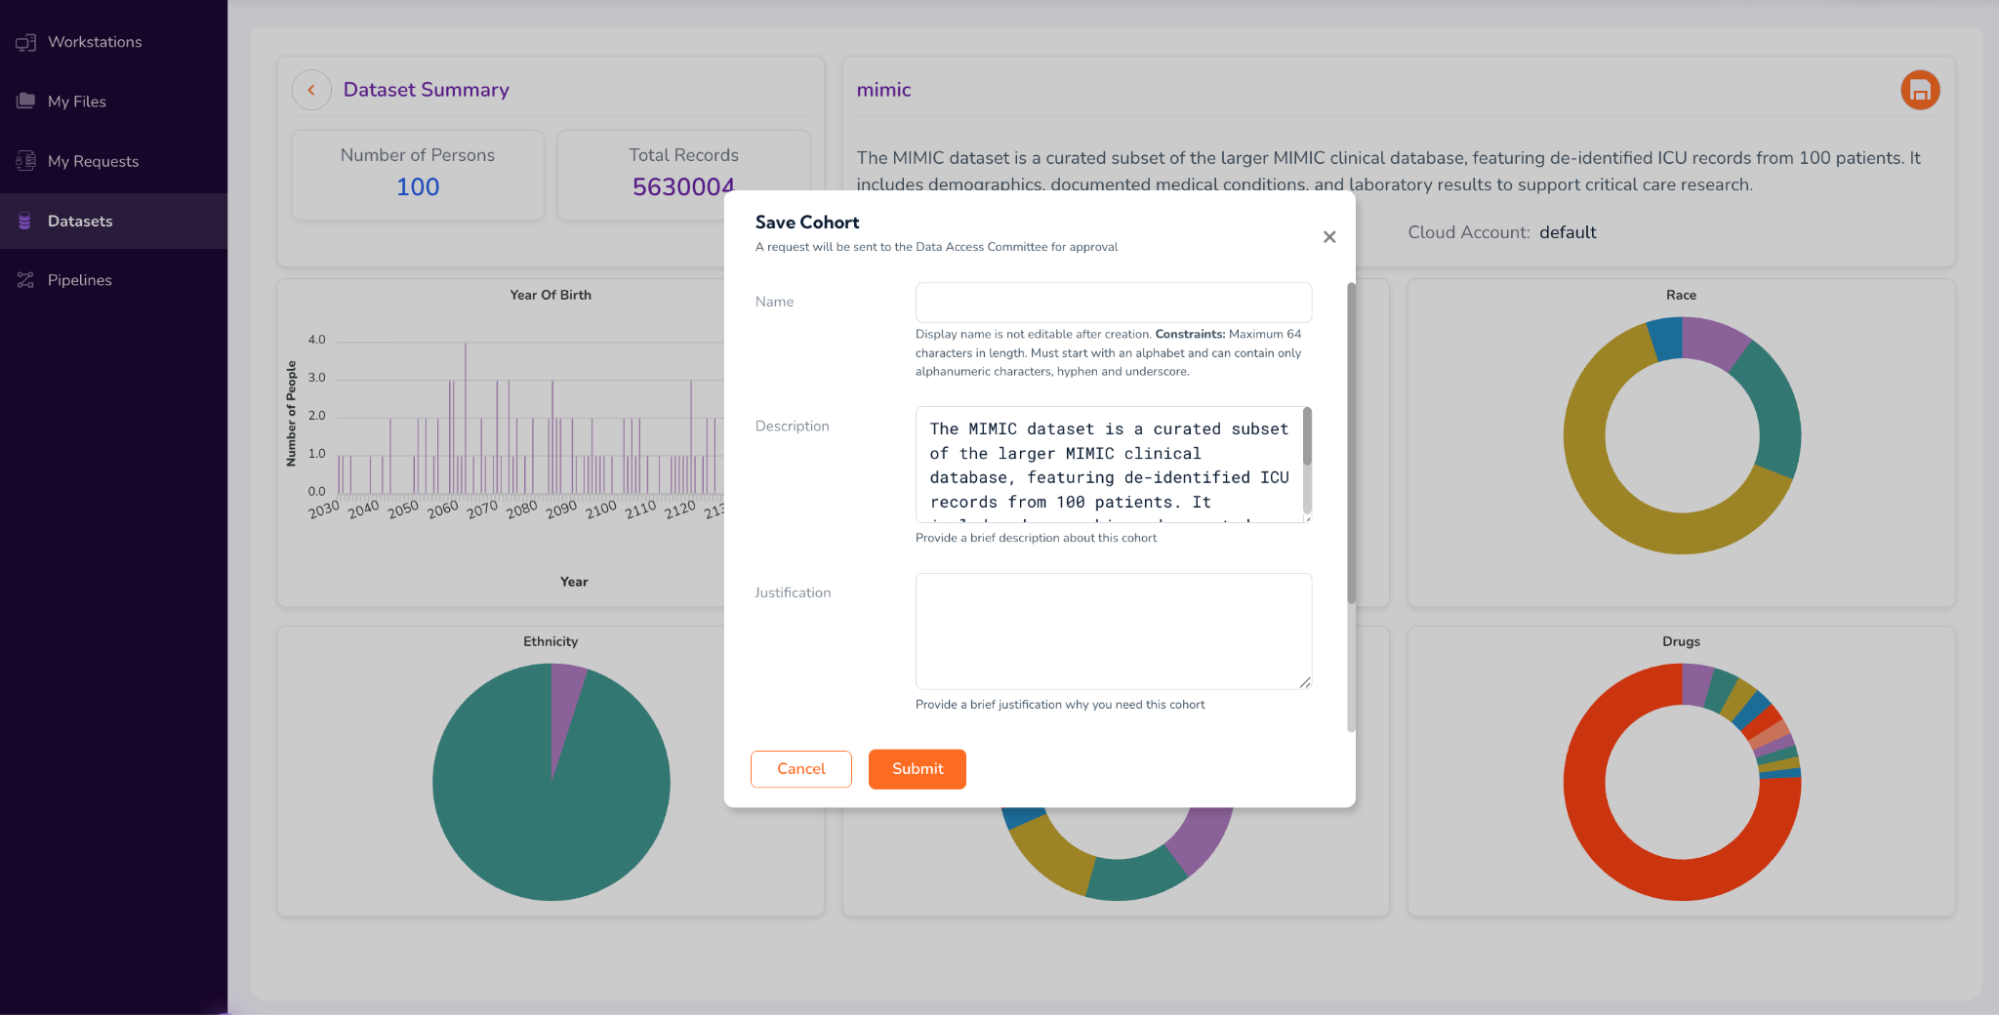
Click “Submit” in the form above, and proceed to Step 3.[a]
Step 3: Create a Cohort
Getting Access to the data from multiple datasets:
- To create or build a cohort, select “Datasets” on the left Navigation pane.
- Click the “Cohorts” tab on the top of the screen
- Click the “Add Cohort” button on the top right corner of the screen
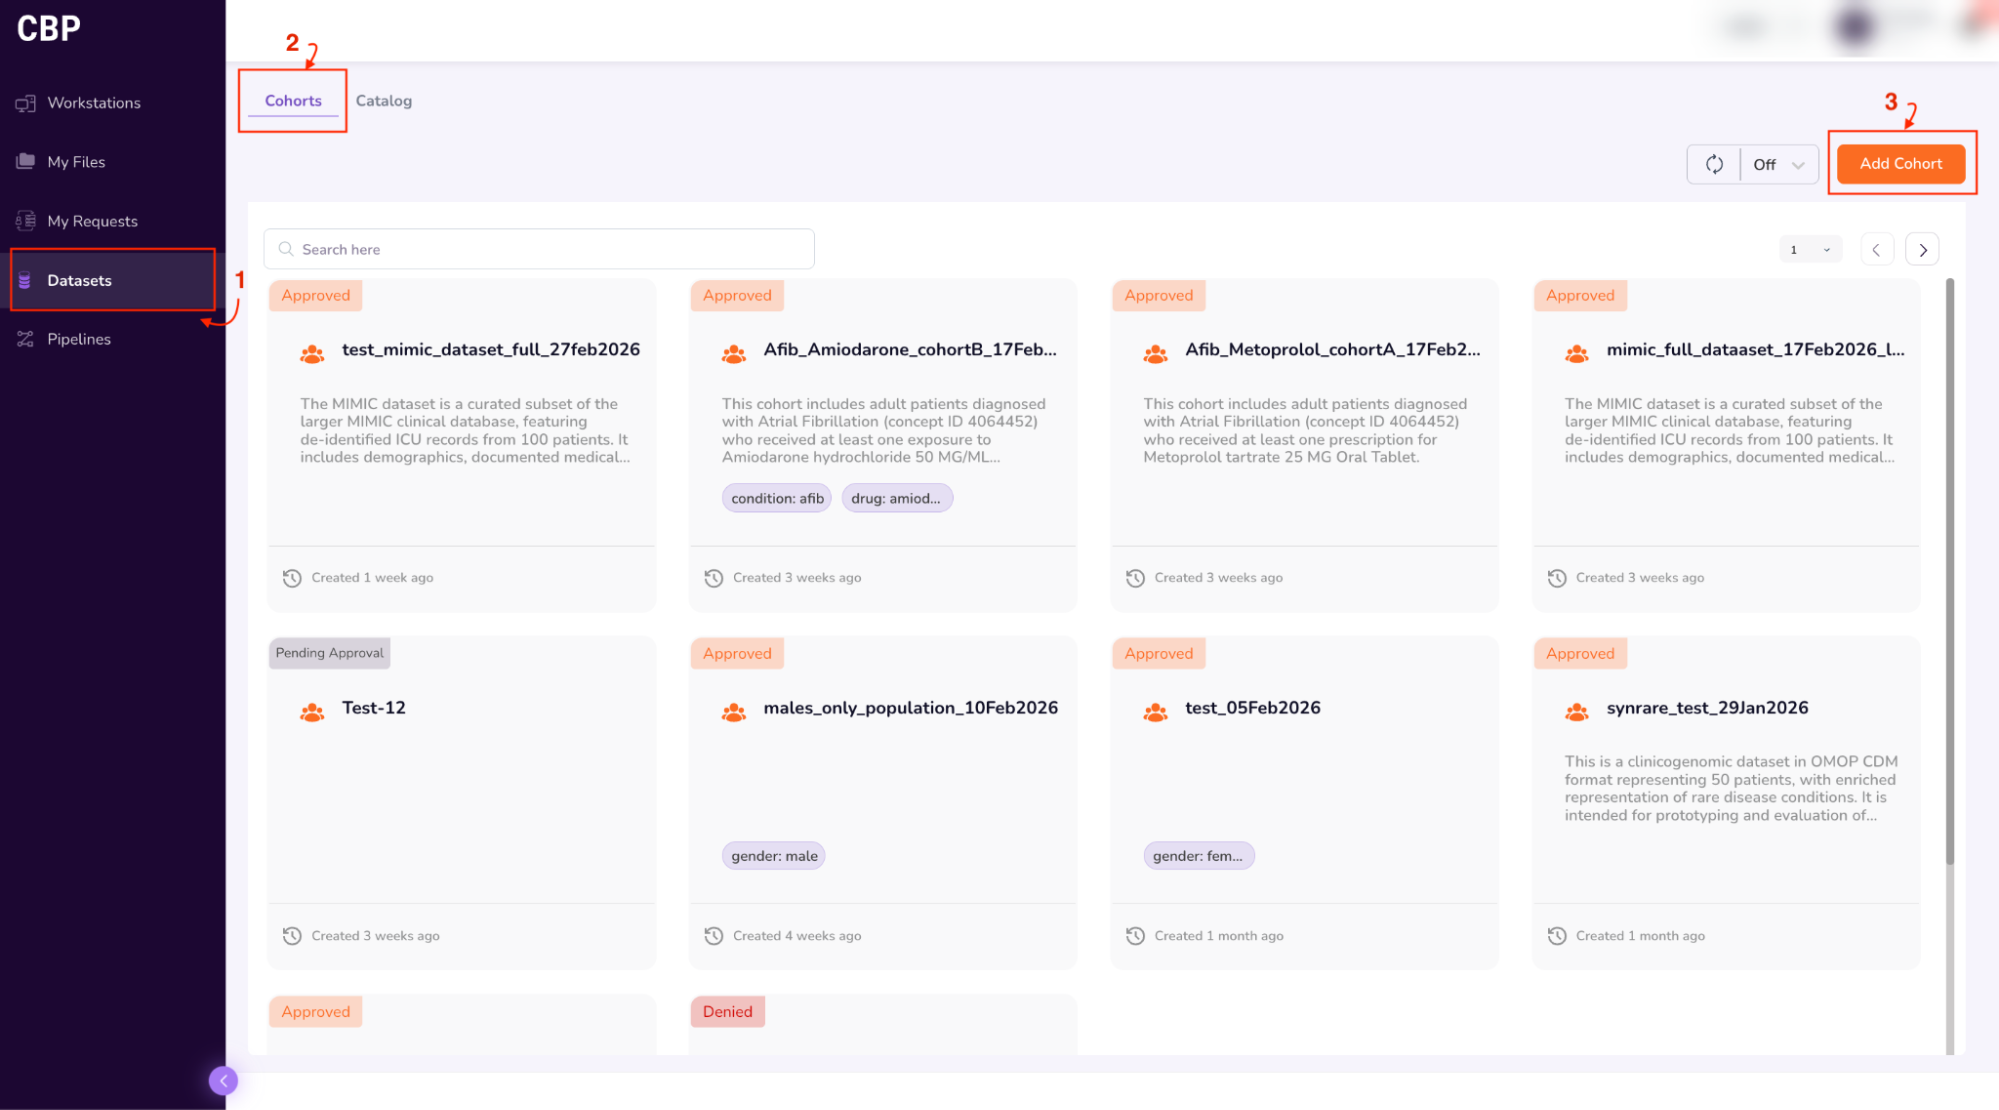
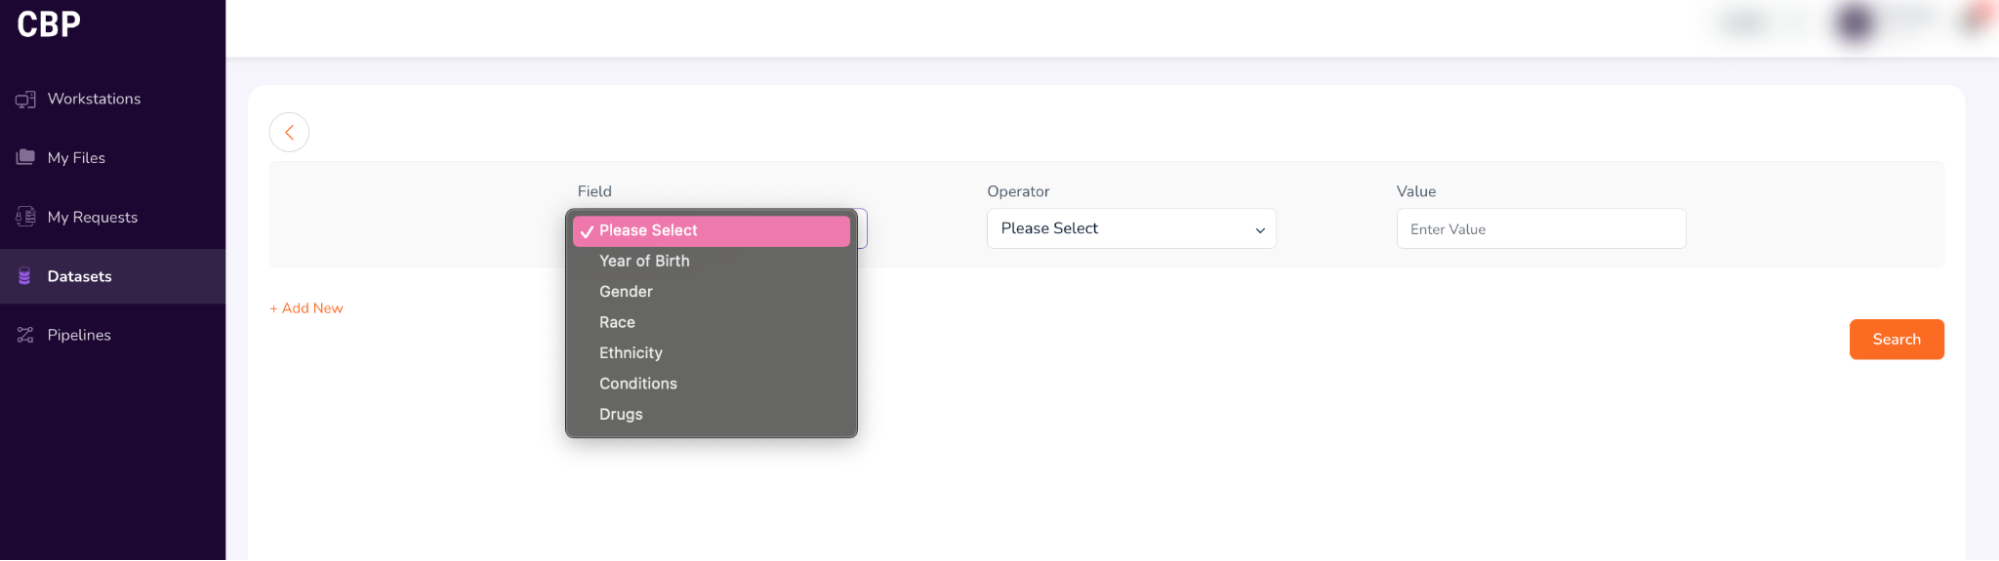
- This will take you to the Query Builder, which allows you to build a cohort using filtering criteria (drop-down options such as data attributes (Year of Birth, Gender, Race, Ethnicity, Condition, Drug), and logical operators (=, !=)).
-
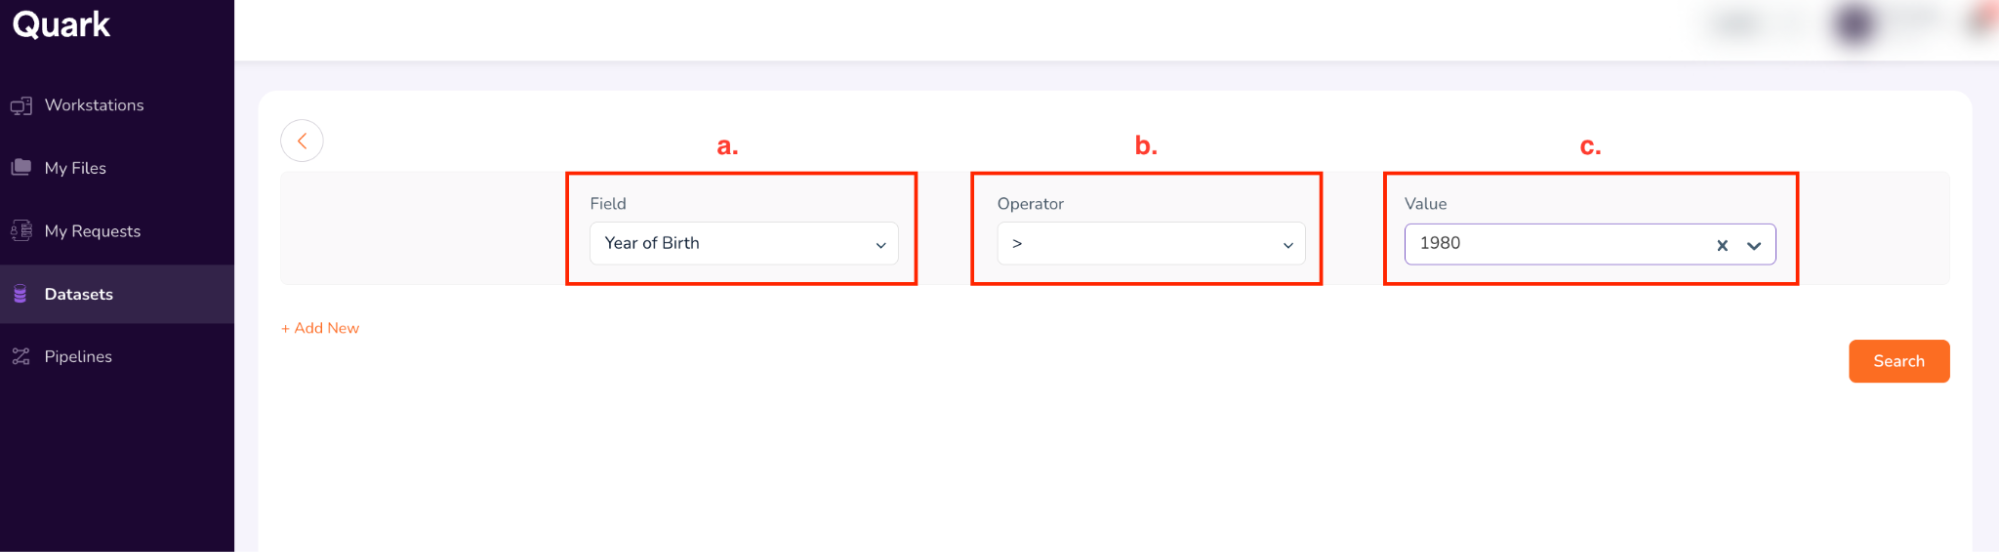
For example: In this workshop, use the following terms to build your cohort:
-
Field: Year of Birth (select from drop-down)
-
Operator: > (select from drop-down)
-
Value: 1980 (select from drop-down)
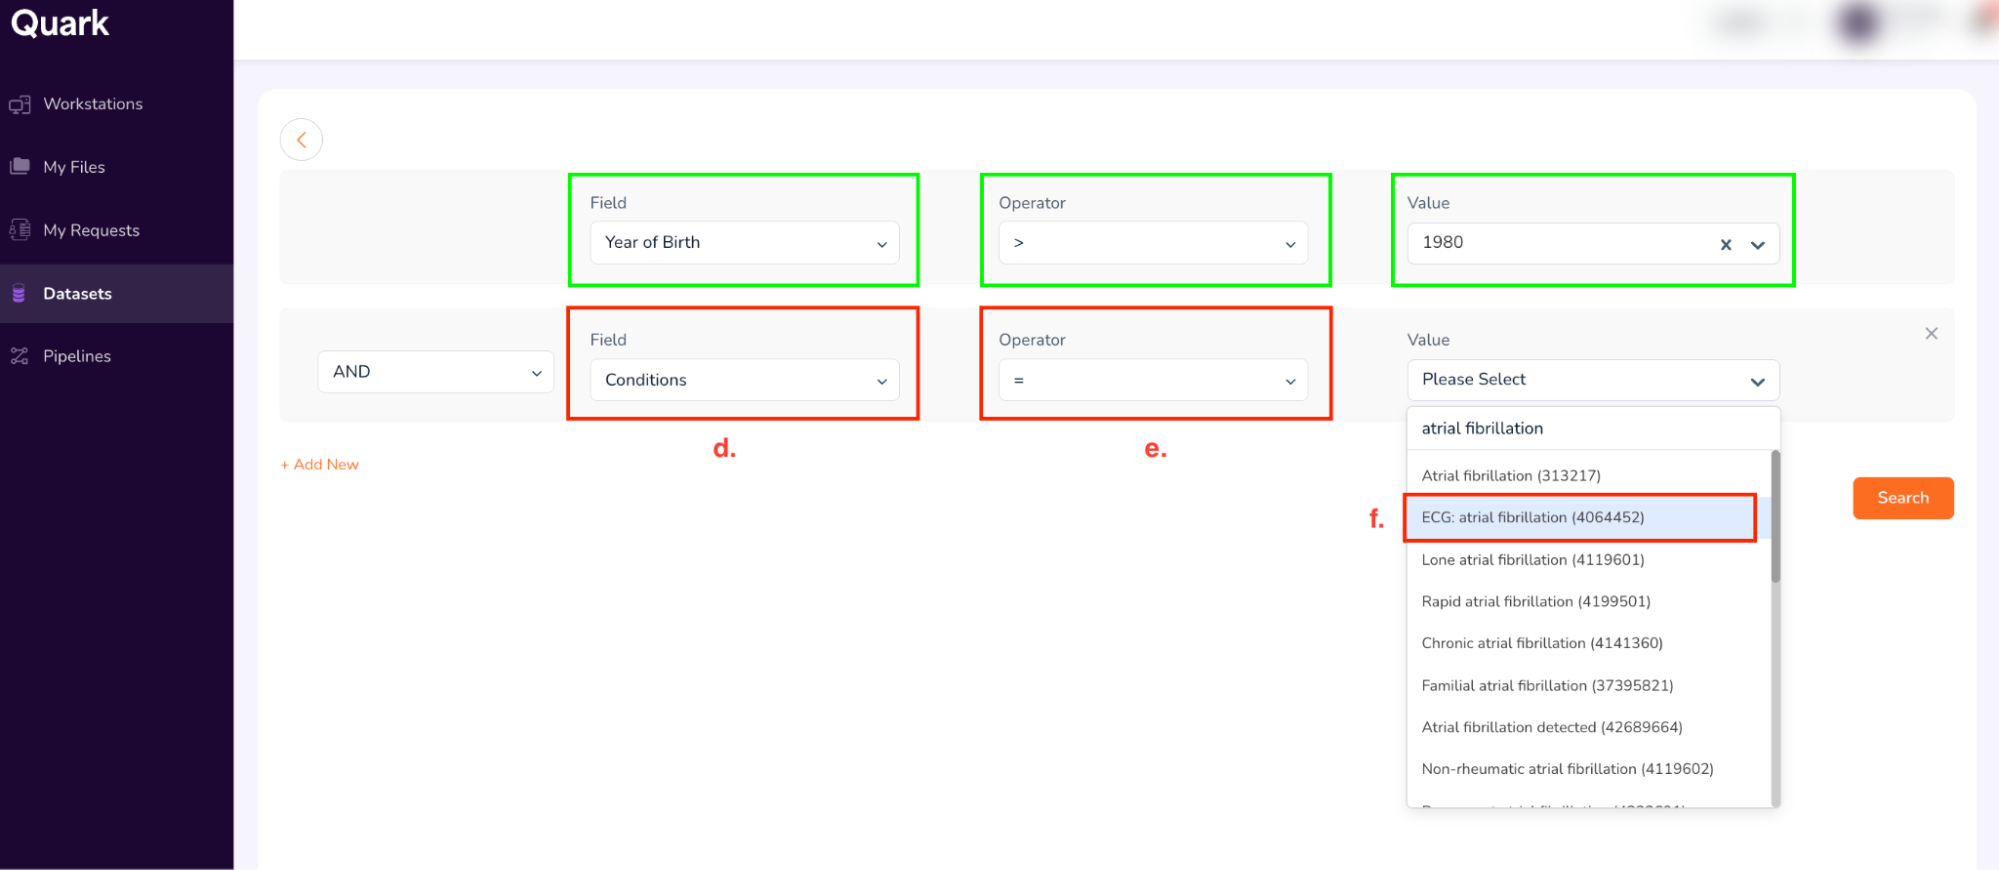
Click on “+ Add New” to add new search terms.
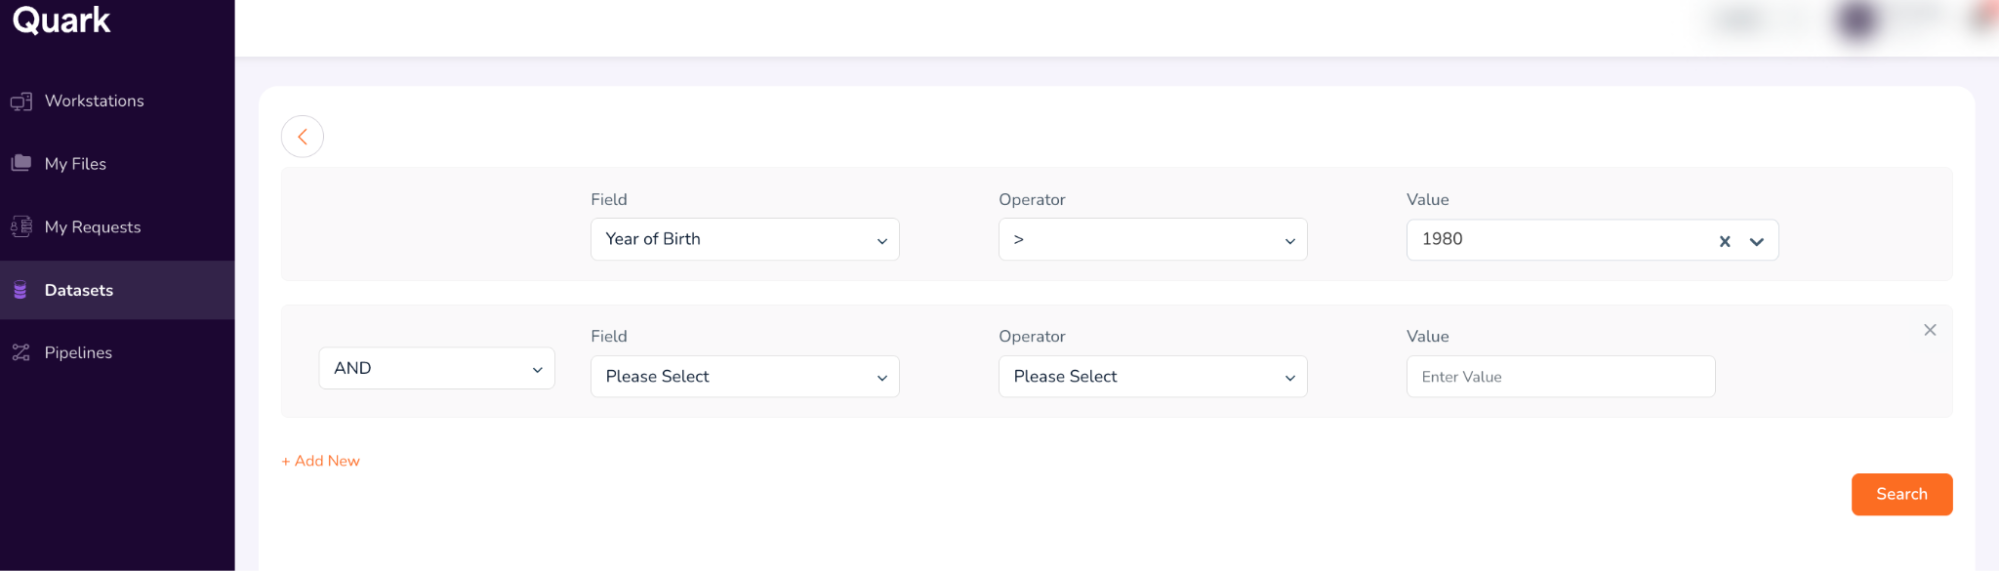
Use the following terms to build the second field.
- Field: Conditions (select from drop-down)
- Operator: = (select from dropdown)
- Value: Atrial Fibrillation (Type, and then select as shown below)
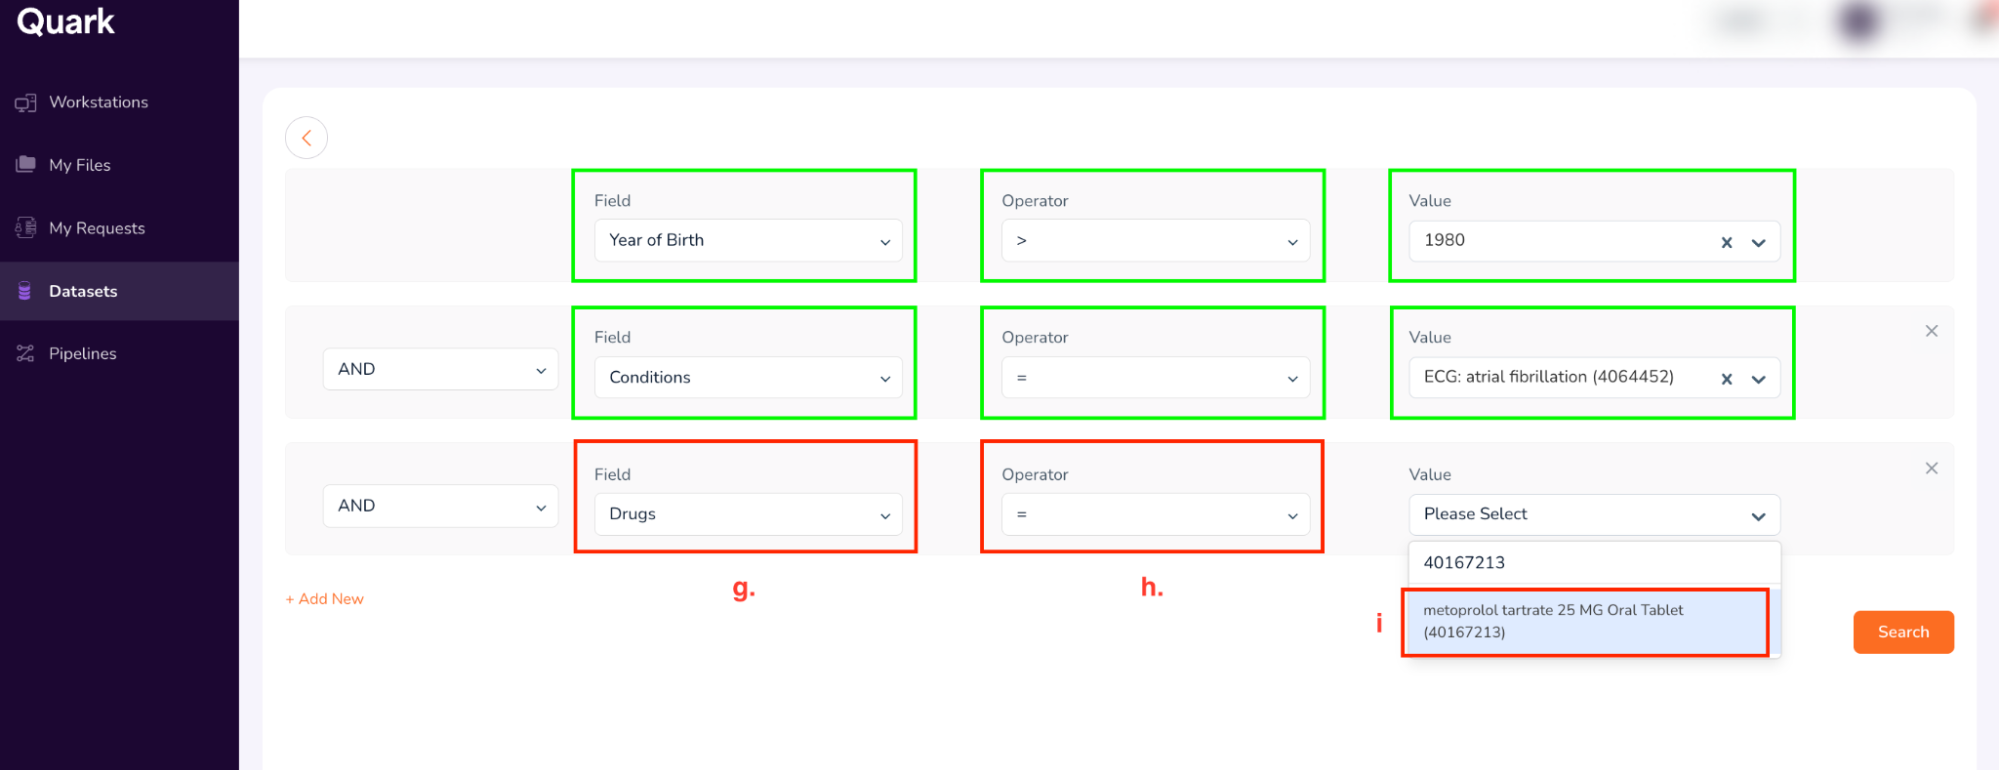
Click on “+ Add New”. For the new row, use the following search terms:
- Field: Drug (select from drop-down)
- Operator: = (select from dropdown)
- Value: 40167213 (Type, and then select “metoprolol tartarate 25 MG Oral tablet” as shown below)
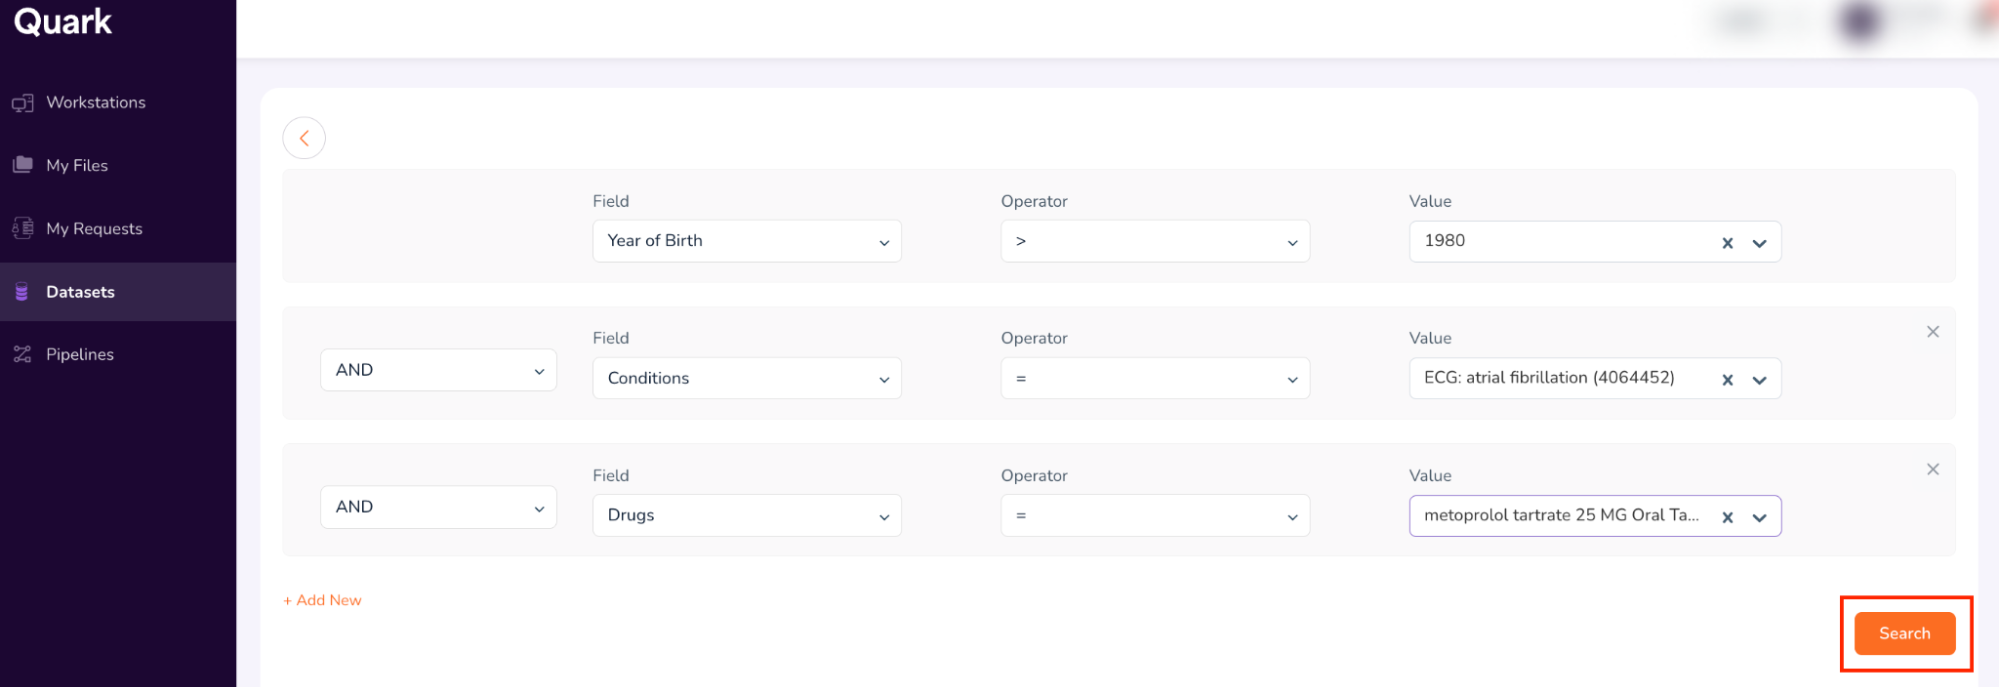
- The final search form looks as shown below. Confirm your entries, and click “Search.”
Step 4: Request Cohort Access
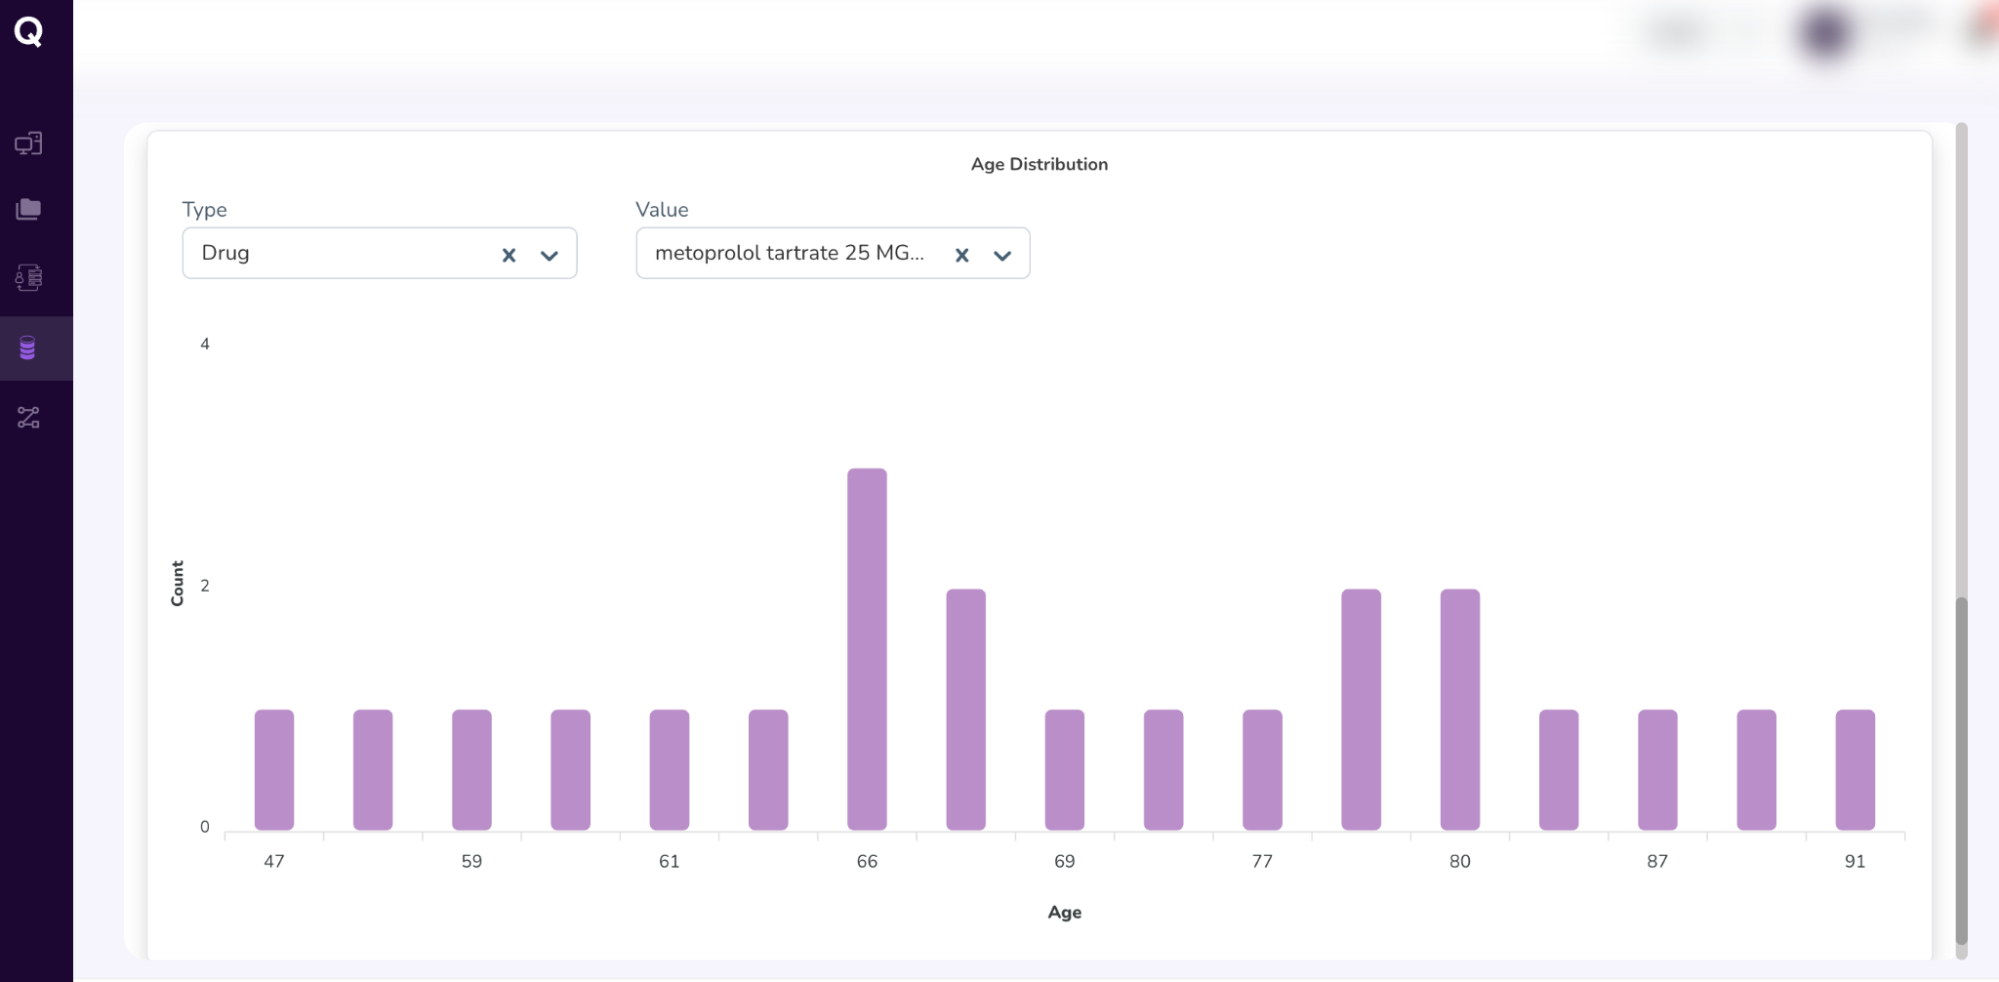
- Running a “Search” retrieves data from all datasets which match the search term(s) entered in Step 3. The Search function then summarizes all retrieved data in a single dashboard called the “Cohort Dashboard” or “Cohort Summary.”
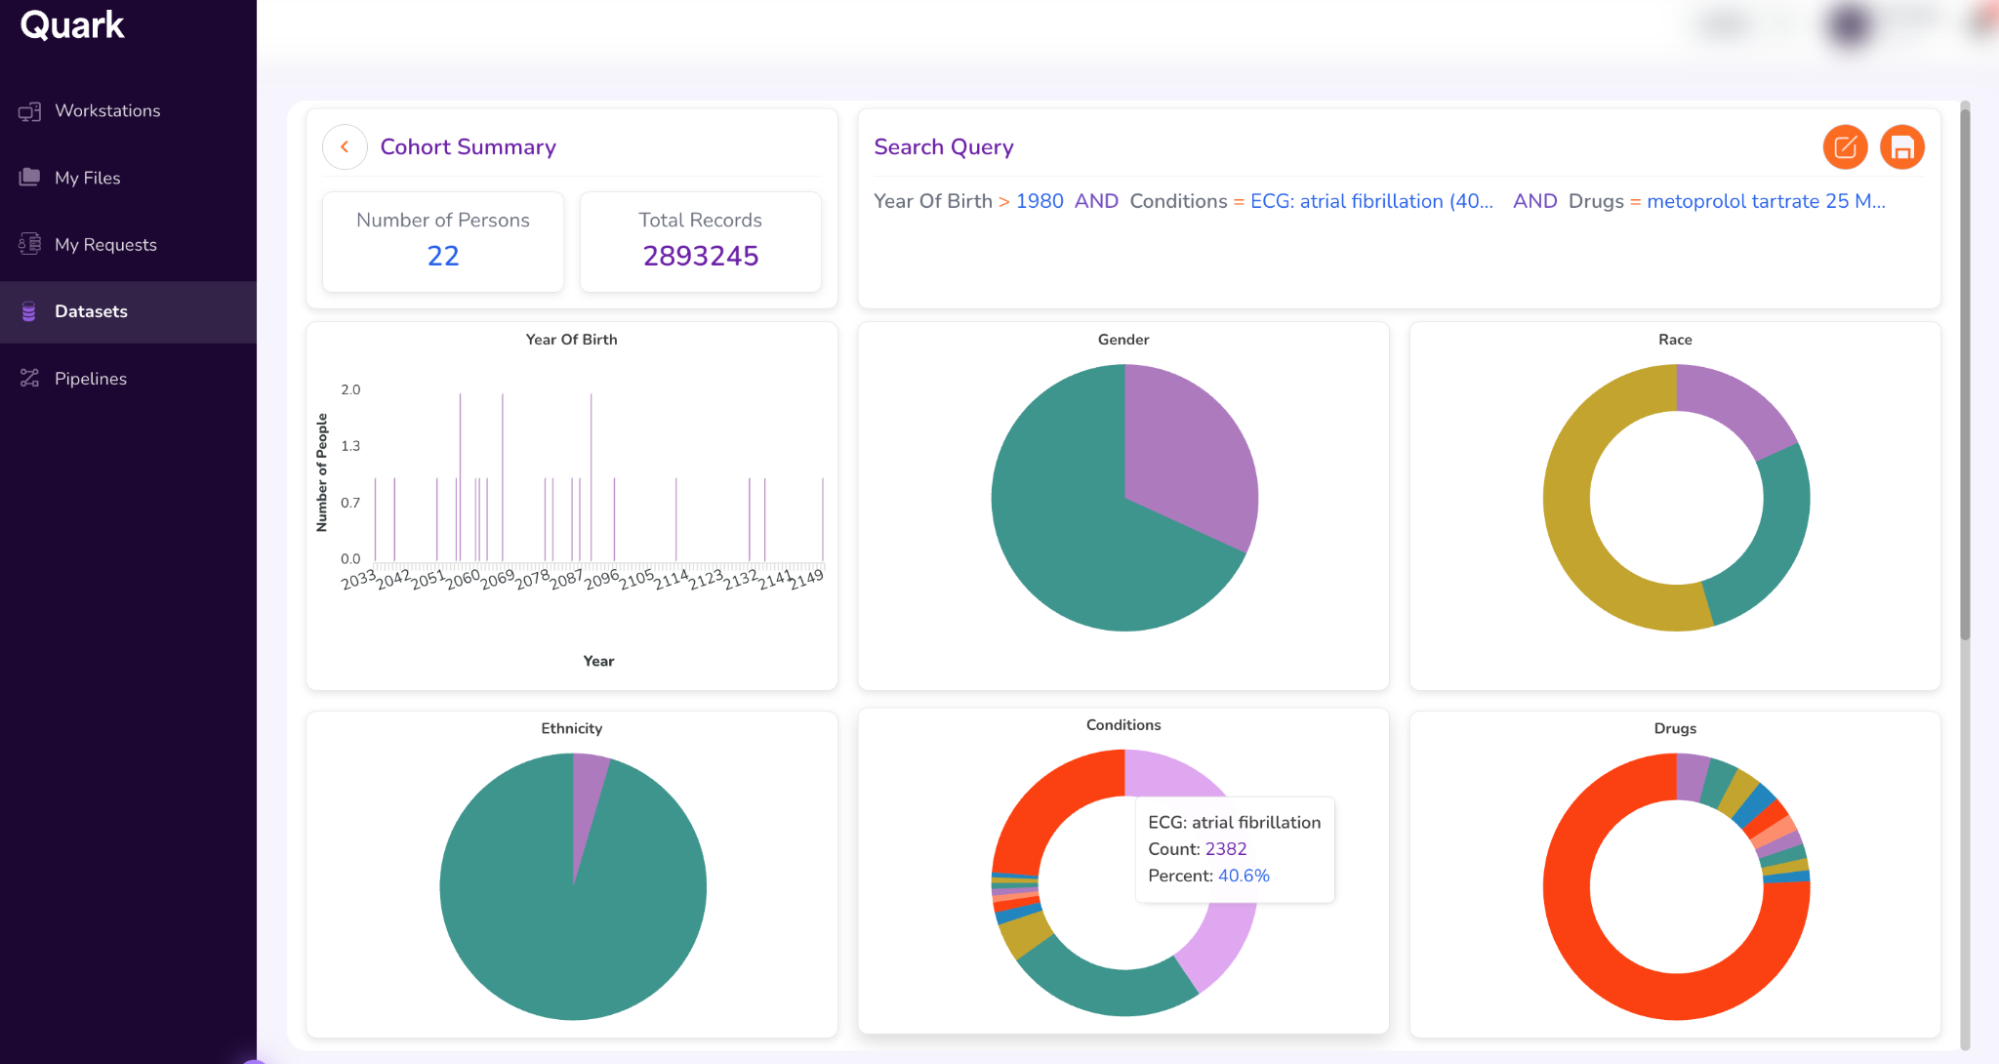
- Explore cohort attributes, including Age Distribution.
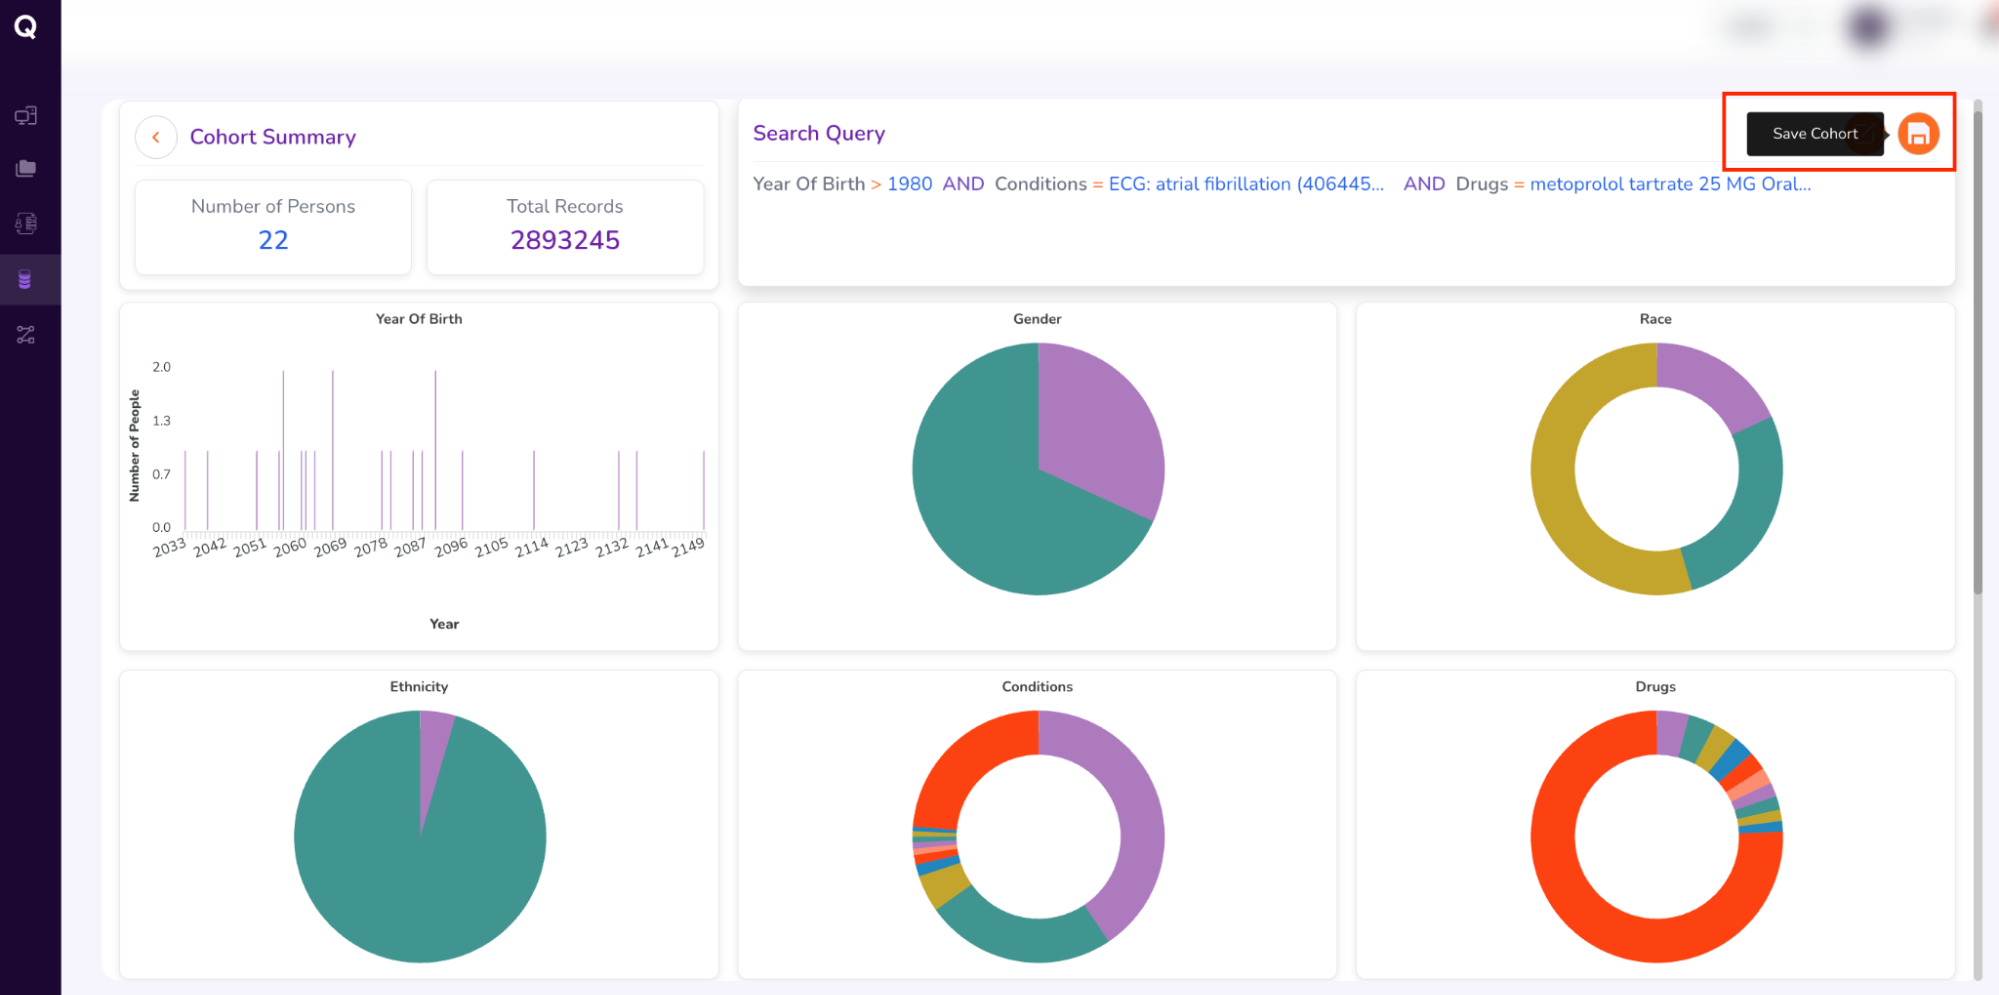
- Once you’ve confirmed your cohort attributes, request access to the cohort you’ve built by scrolling to the top, and clicking the “Save Cohort” icon.
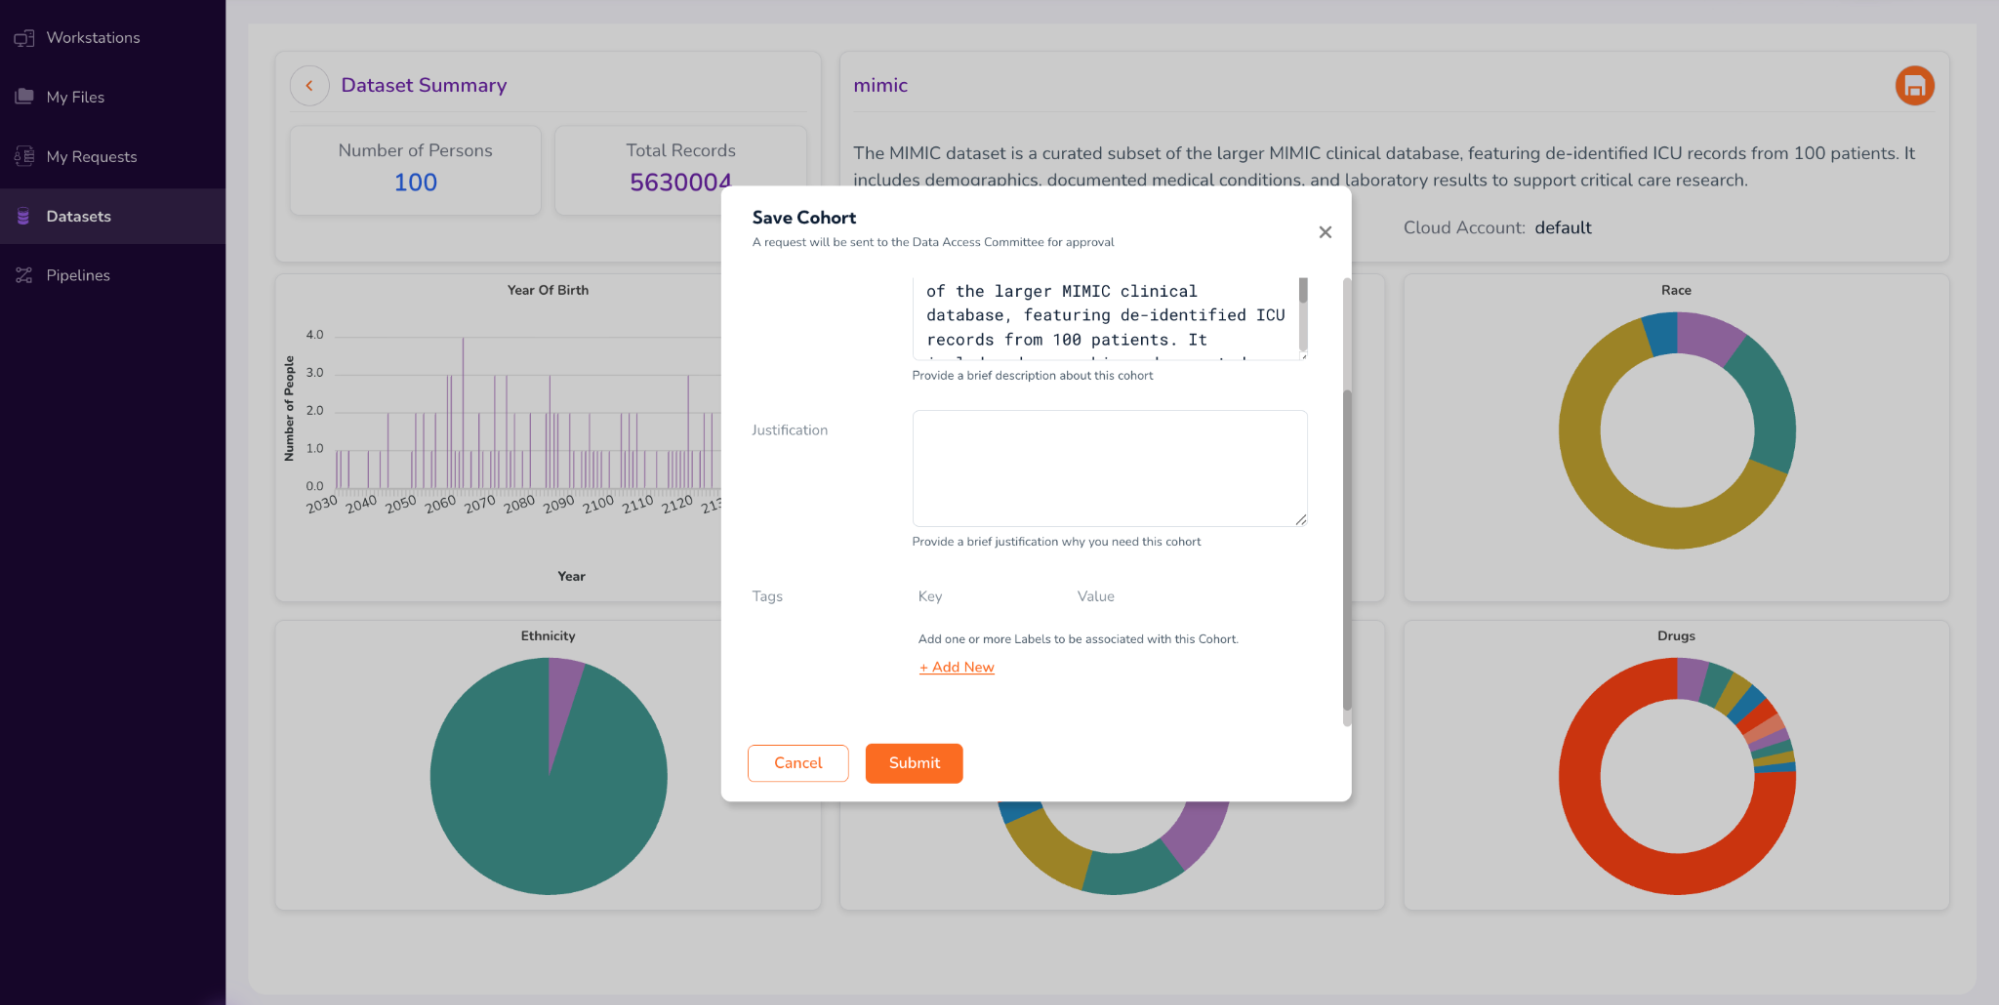
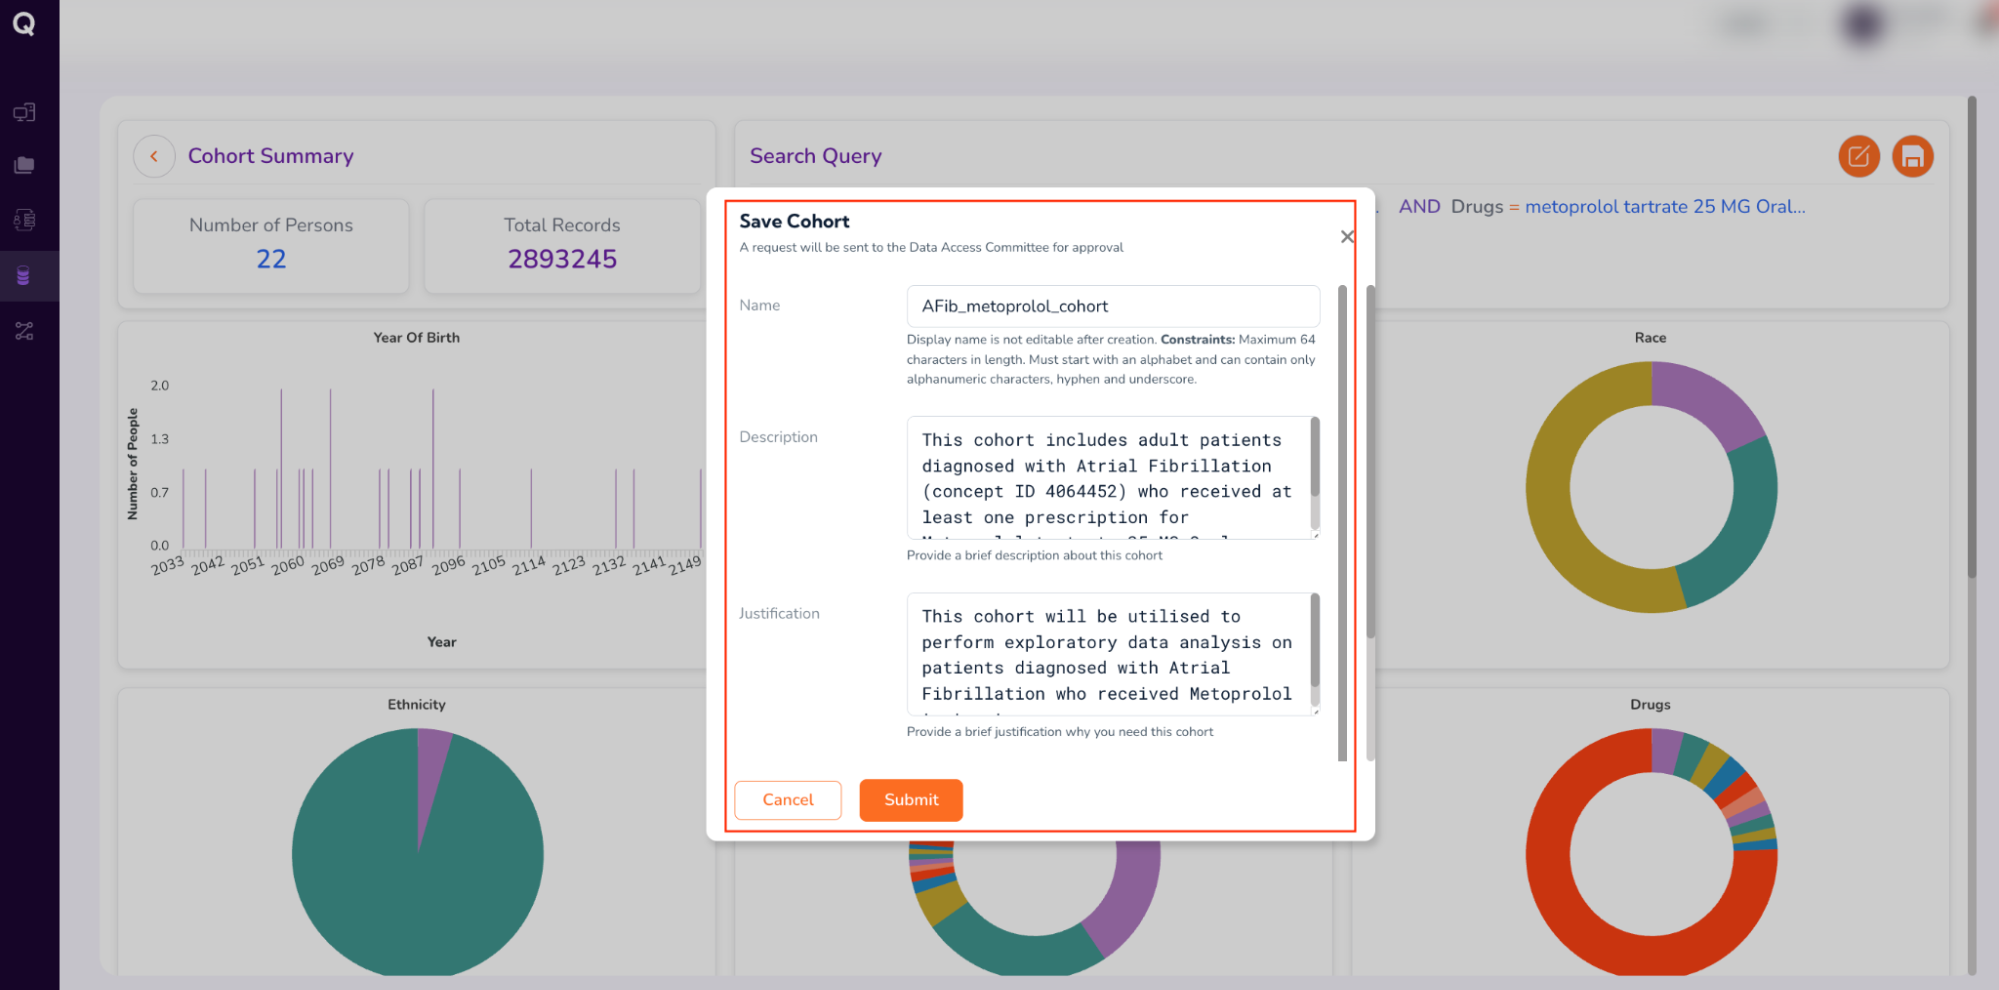
- Fill out the form (which will be sent to the Data Access Committee for approval). Enter your cohort’s “Name,” a brief “Description,” “Justification” for requesting the cohort, and “Tags” to retrieve your cohort, as follows:
- Name: AFib_metoprolol_cohort
- Description: This cohort includes adult patients diagnosed with Atrial Fibrillation (concept ID 4064452) who received at least one prescription for Metoprolol tartrate 25 MG Oral Tablet.
- Tags: Click “Add New”. Under Key, type “Condition” and under Value, type “AFib”
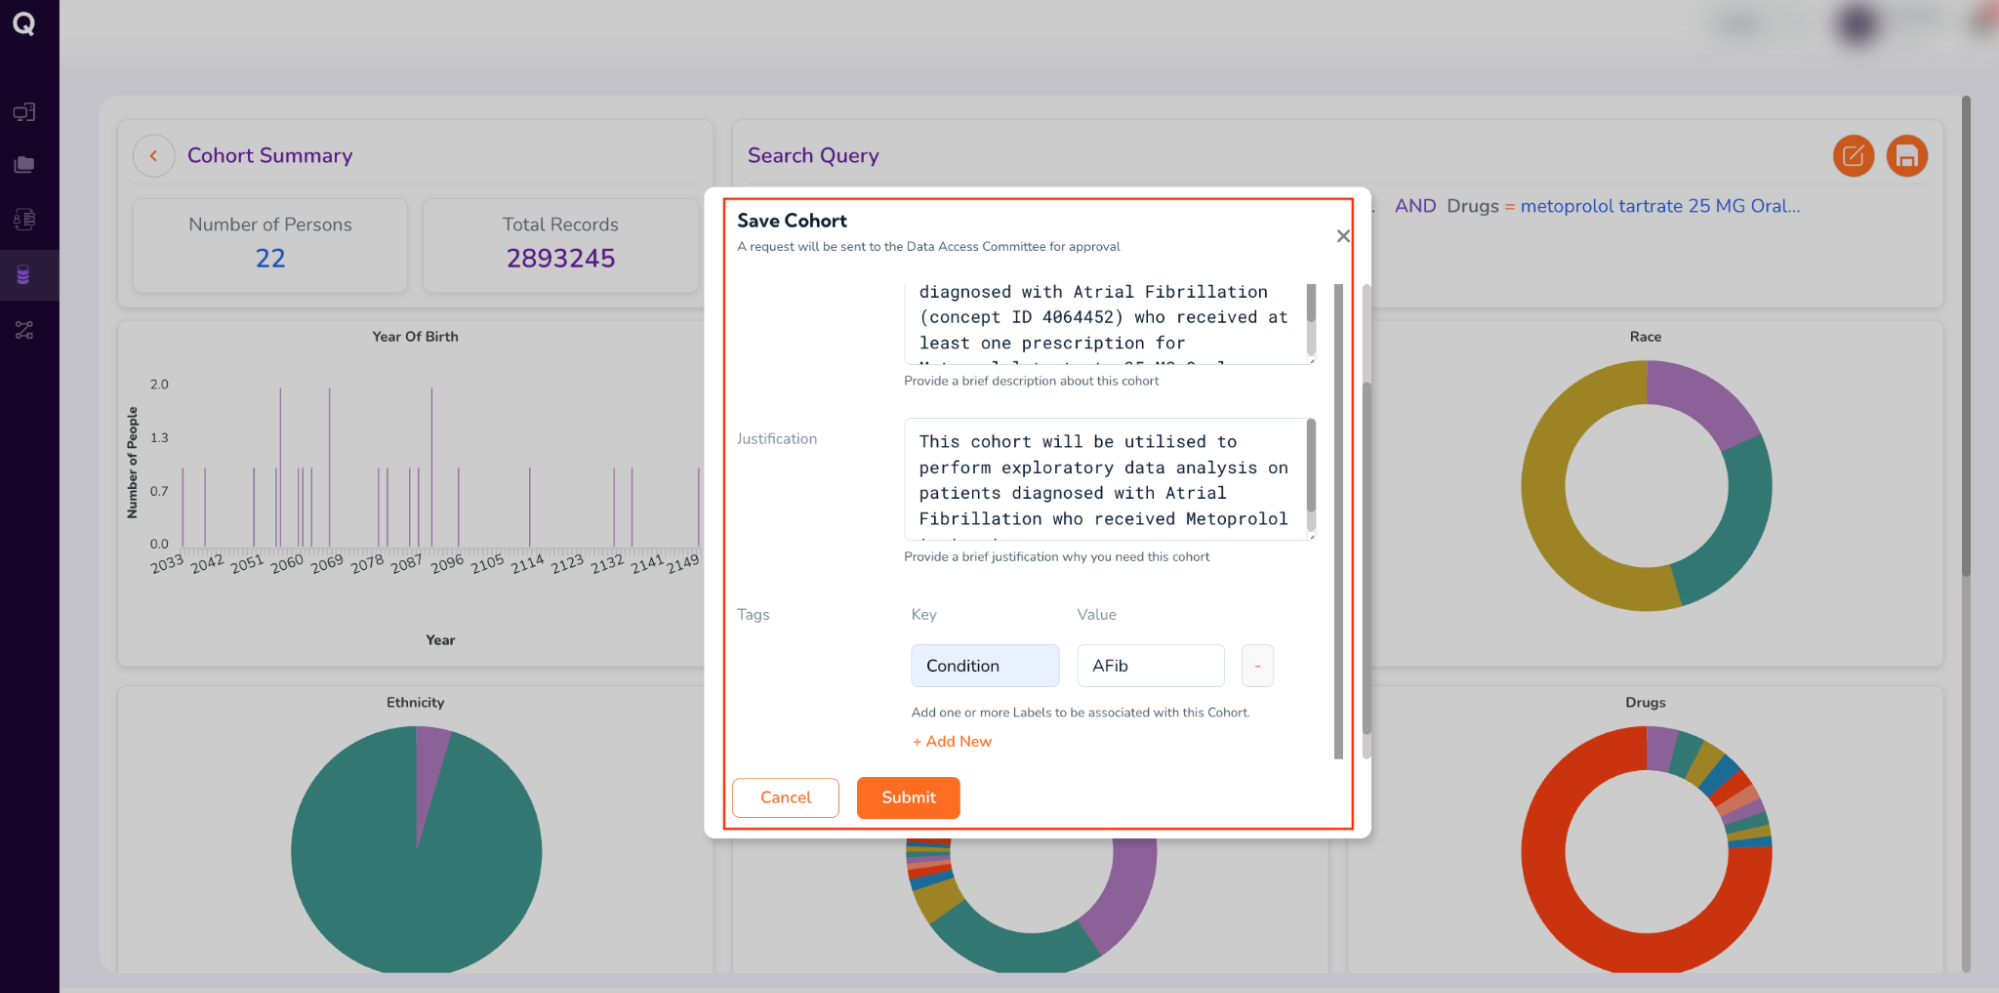
- Review your form entries, and click “Submit.”
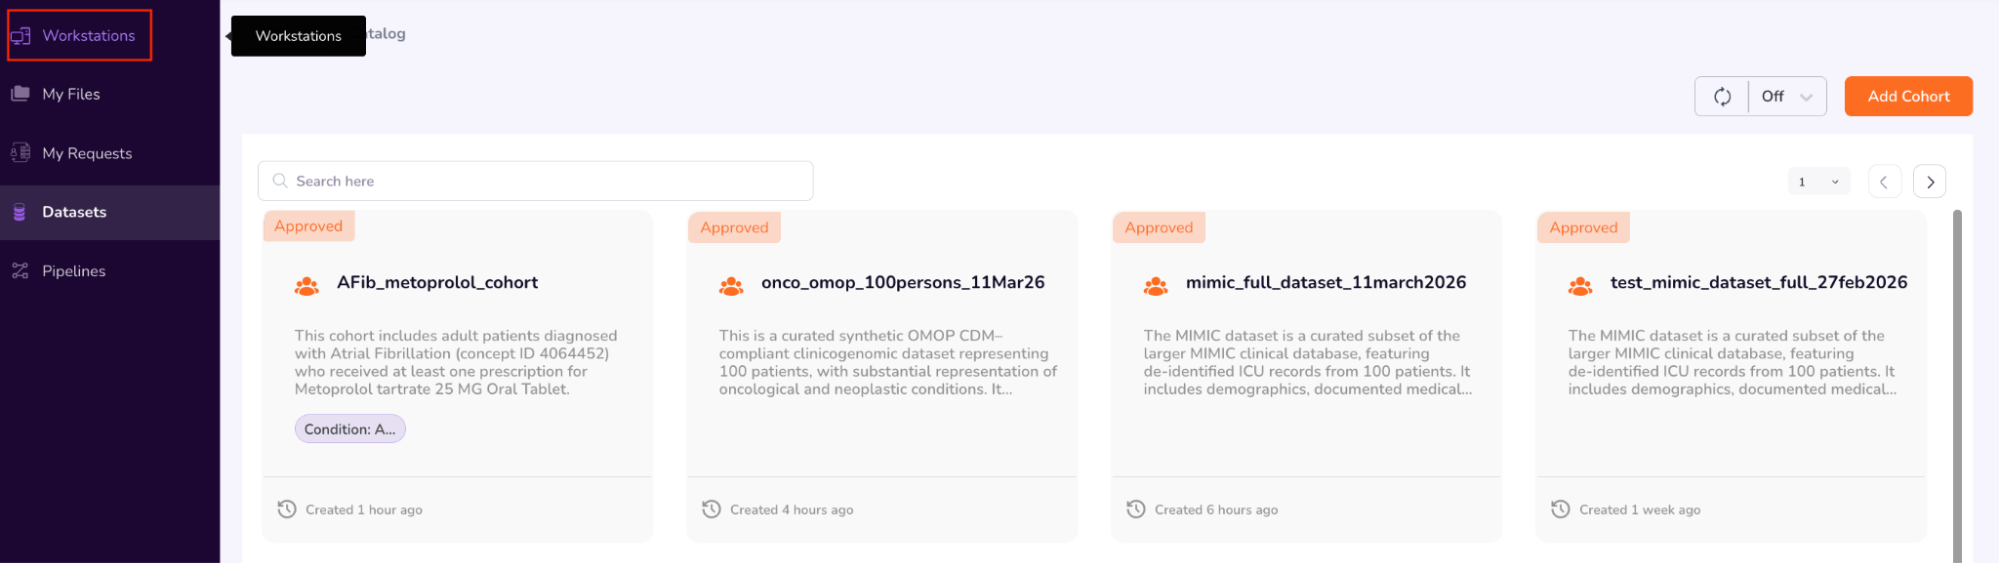
Step 5: Browse Approved Cohort’s Dashboards
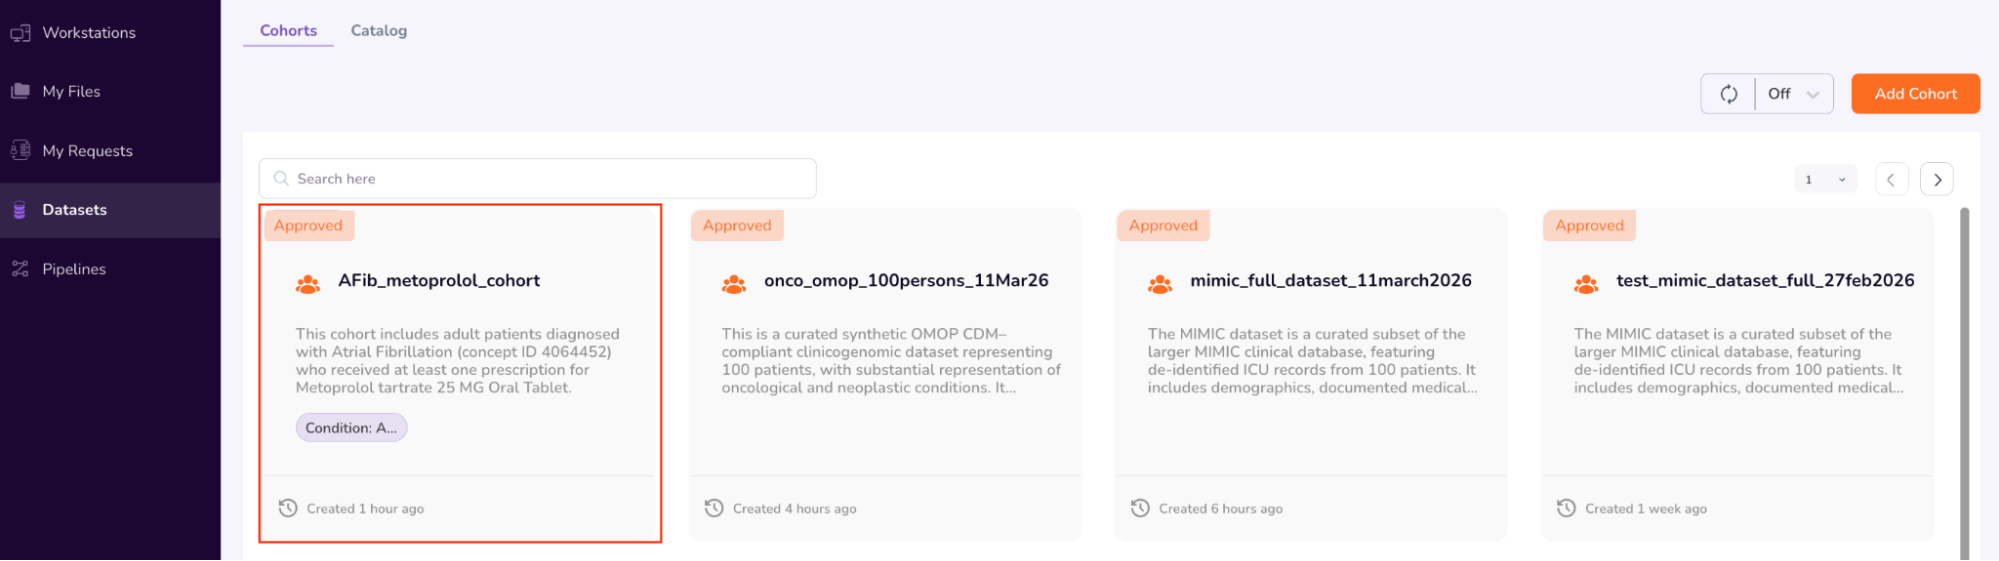
Once you select “Submit,” the Cohort Access Request will be sent to the Data Access Committee (DAC) for review. In your “Datasets” menu, under “Cohorts,” your requested cohort will be labeled as “Pending Approval”.
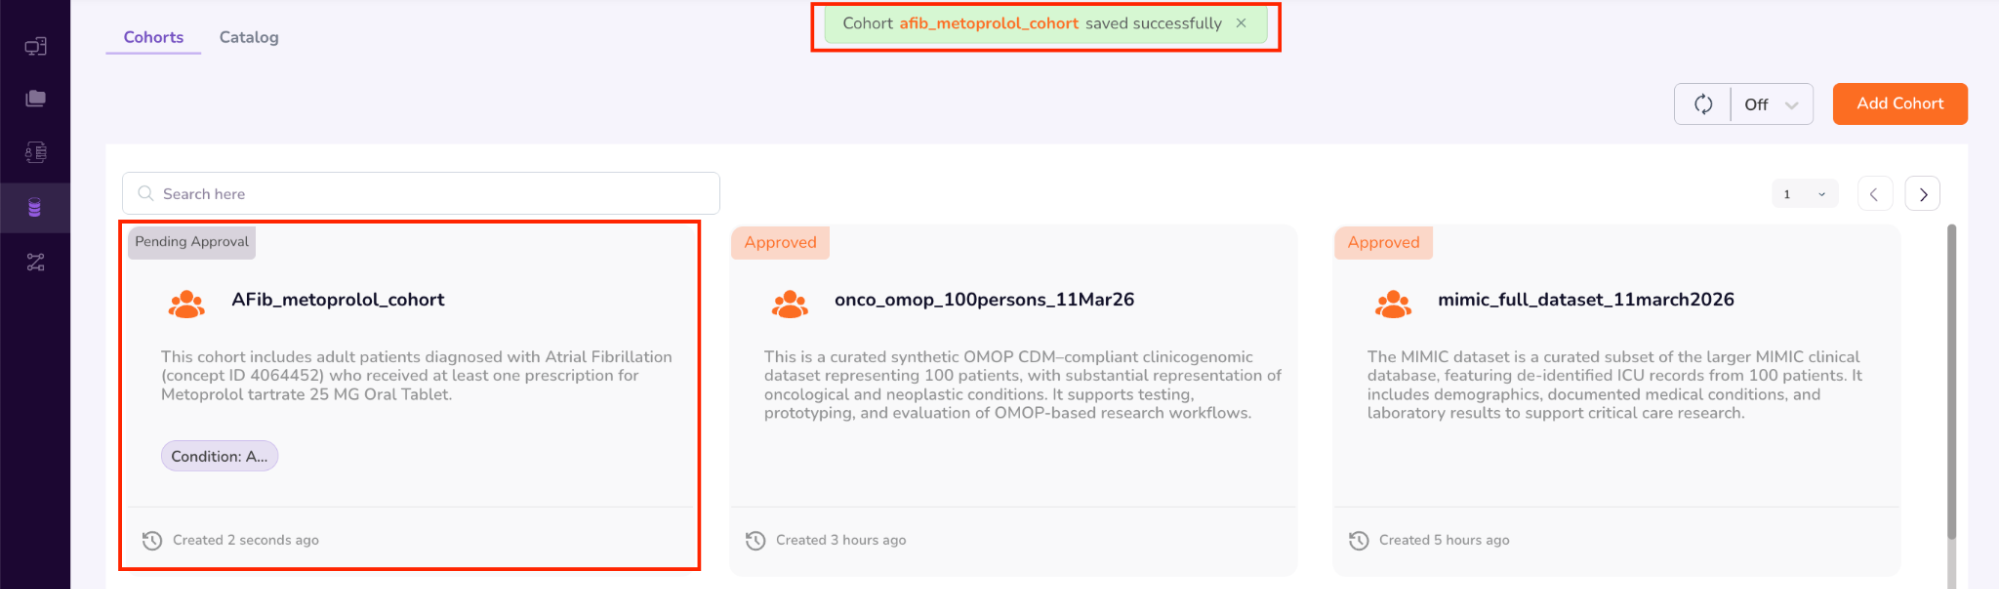
The Cohort Approval process has been initiated.
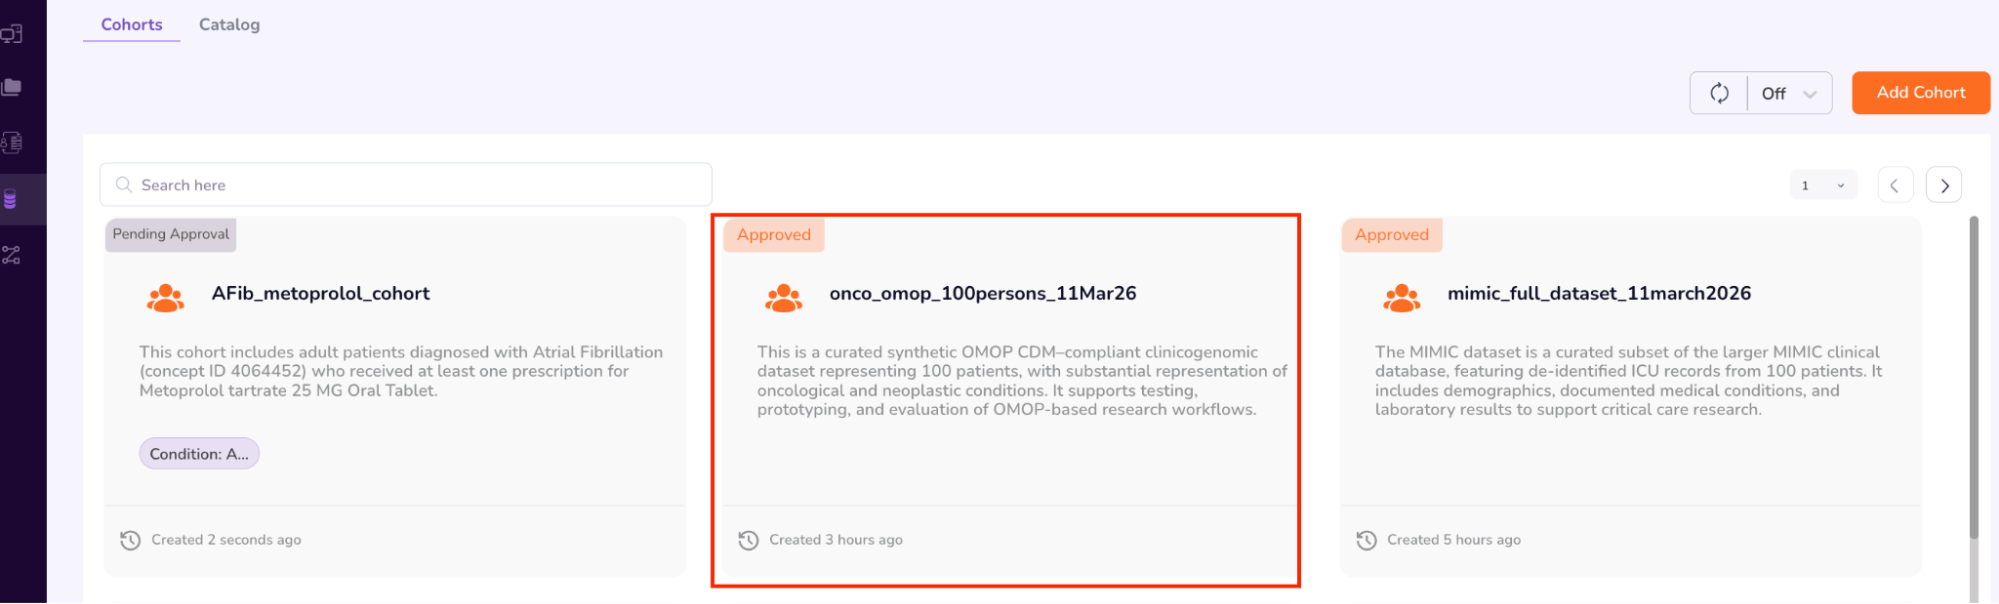
While we wait for the DAC to grant approval, we will use a pre-approved cohort in this workshop to browse through the Cohort Dashboard, Person Dashboard, and Specimen Dashboard.
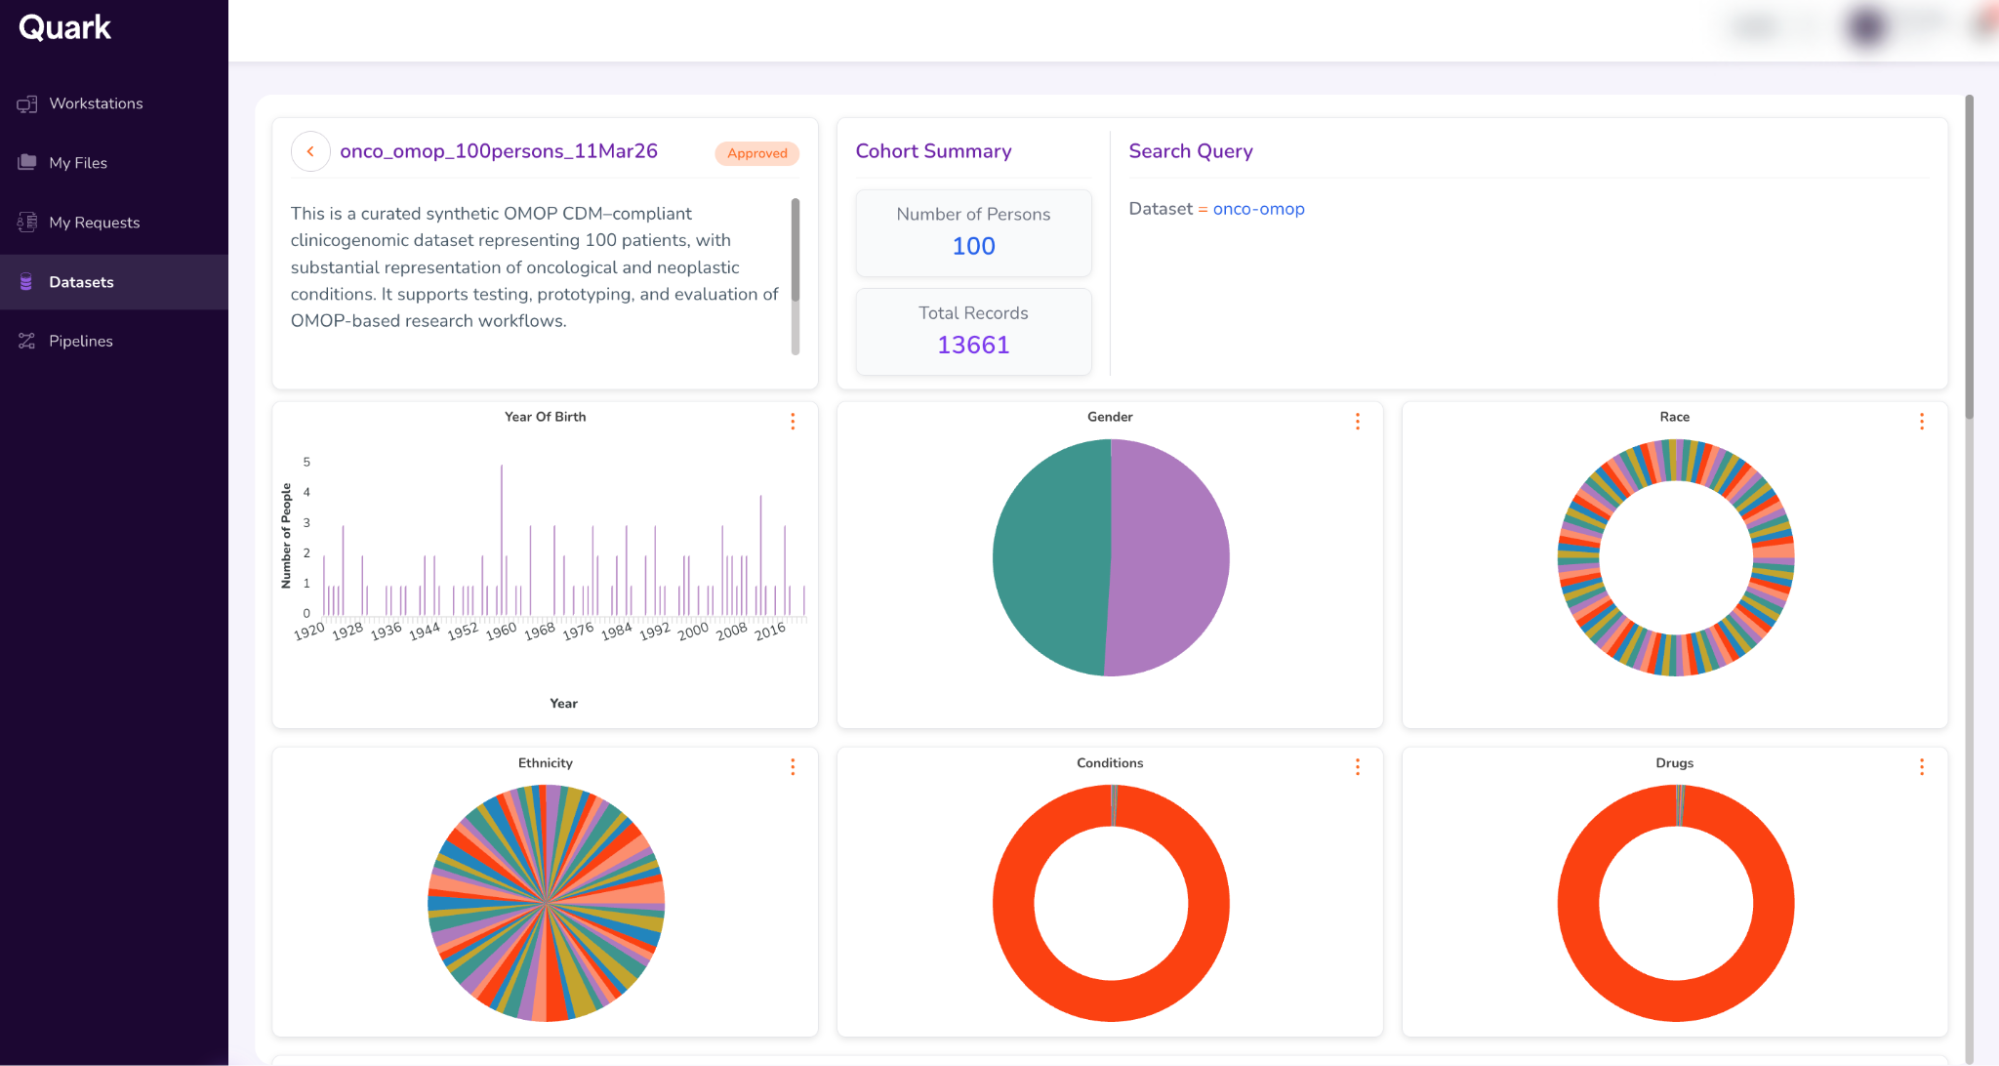
- Click on an Approved Cohort; for example, in this workshop, you may open the “onco_omop_100persons” cohort.
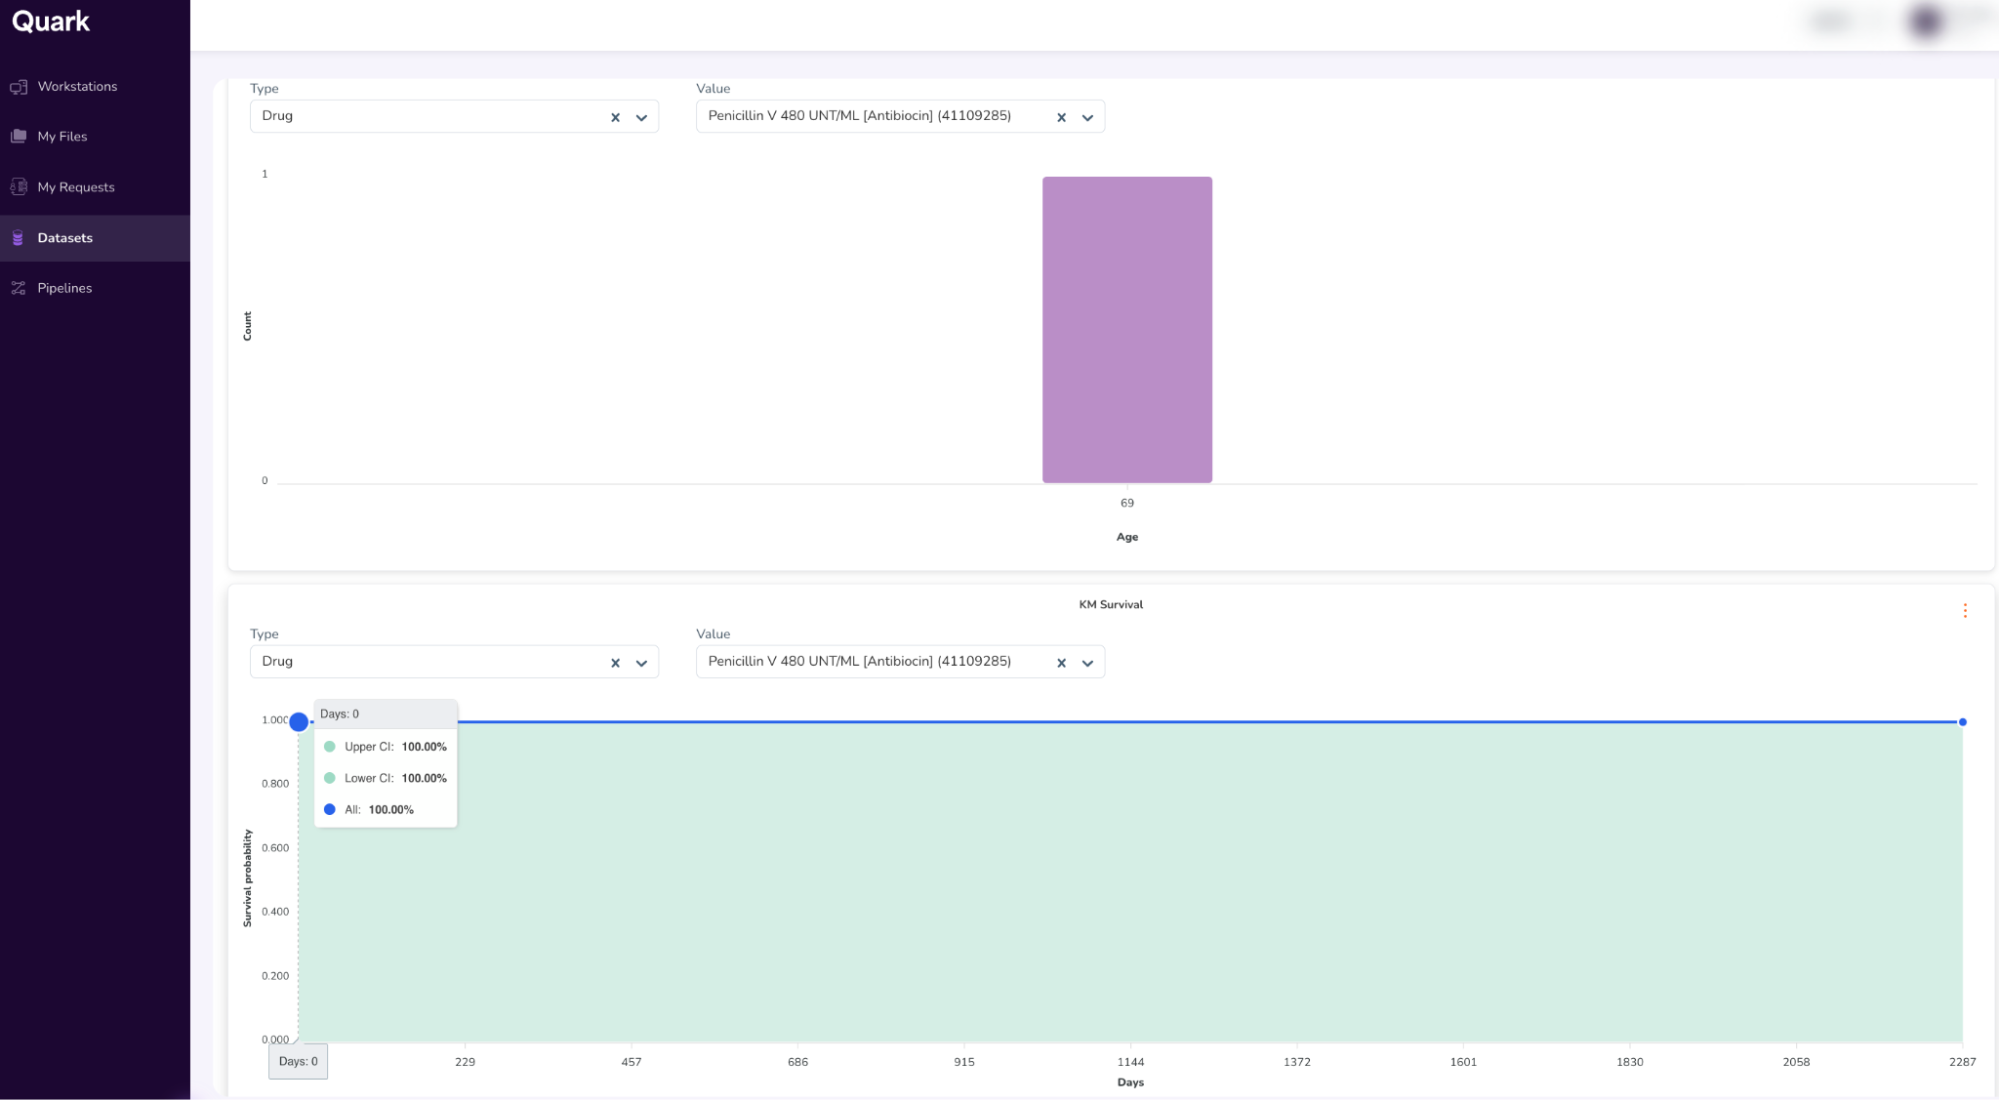
- This will open a dashboard that looks similar to your previous “Cohort Summary” from Step 4. Additionally, when you scroll down, you will also be able to view the Kaplan-Meir survival curve (KM Curve)
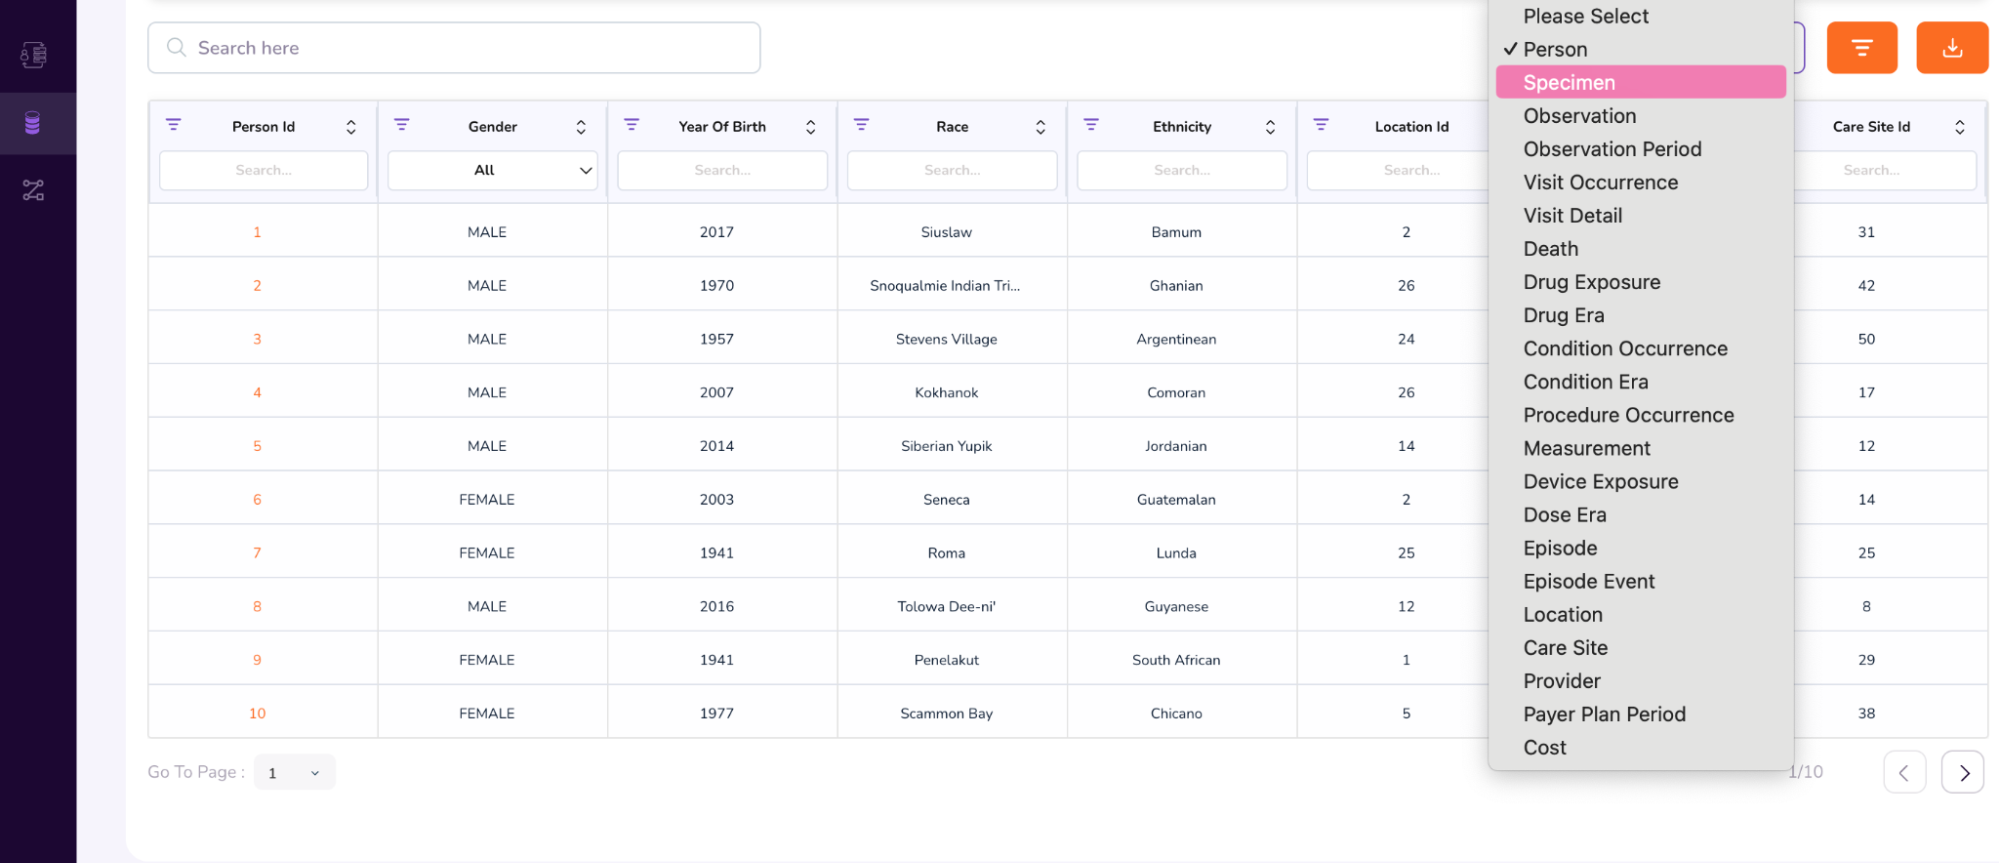
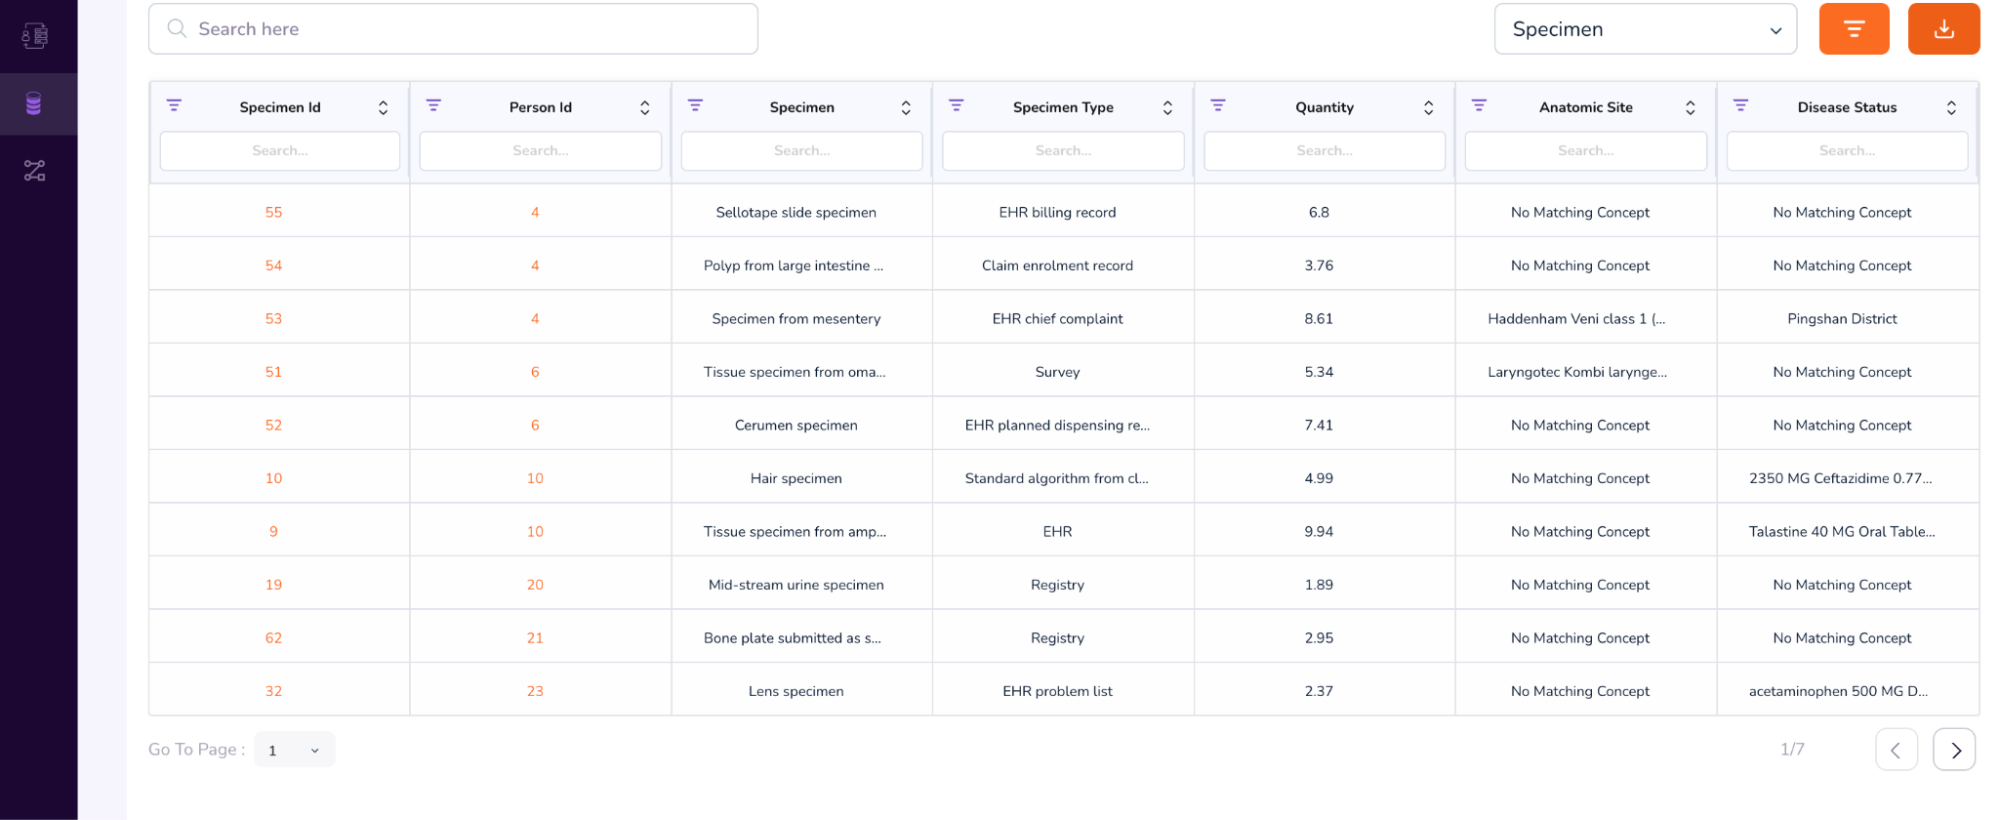
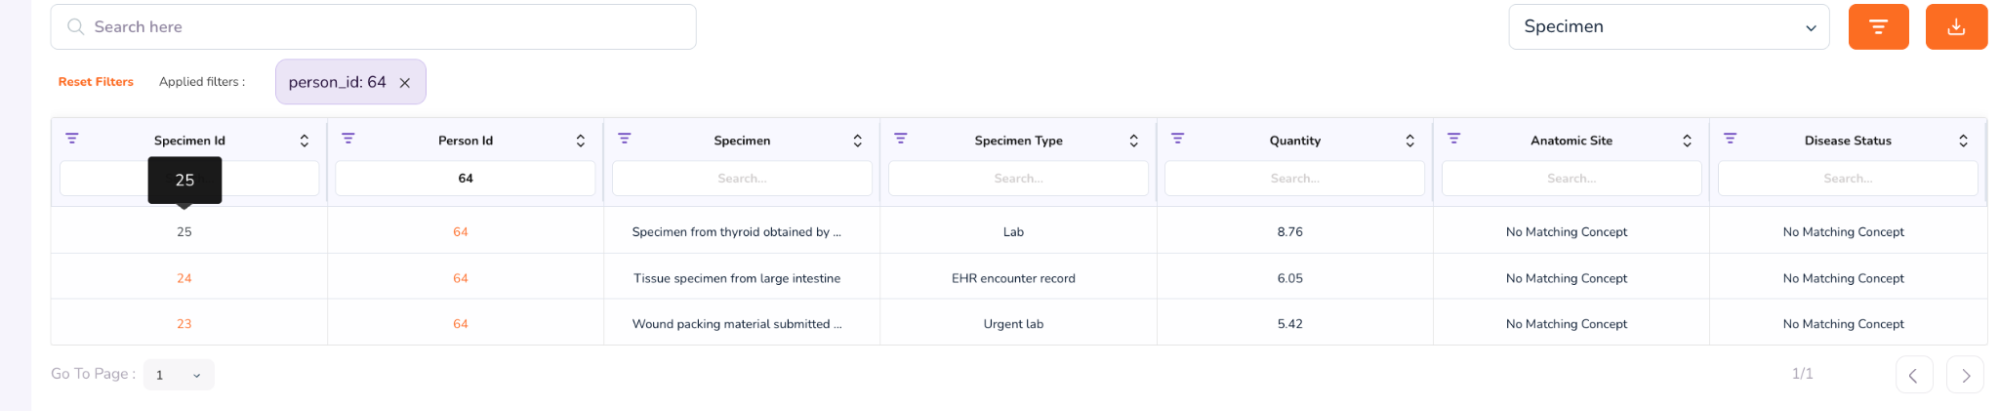
- When you scroll further down, you will be able to access additional attributes, like the Person Table and Specimen Table. (To access the Specimen Table, click the drop-down on the top-right of the table, and select “Specimen”).
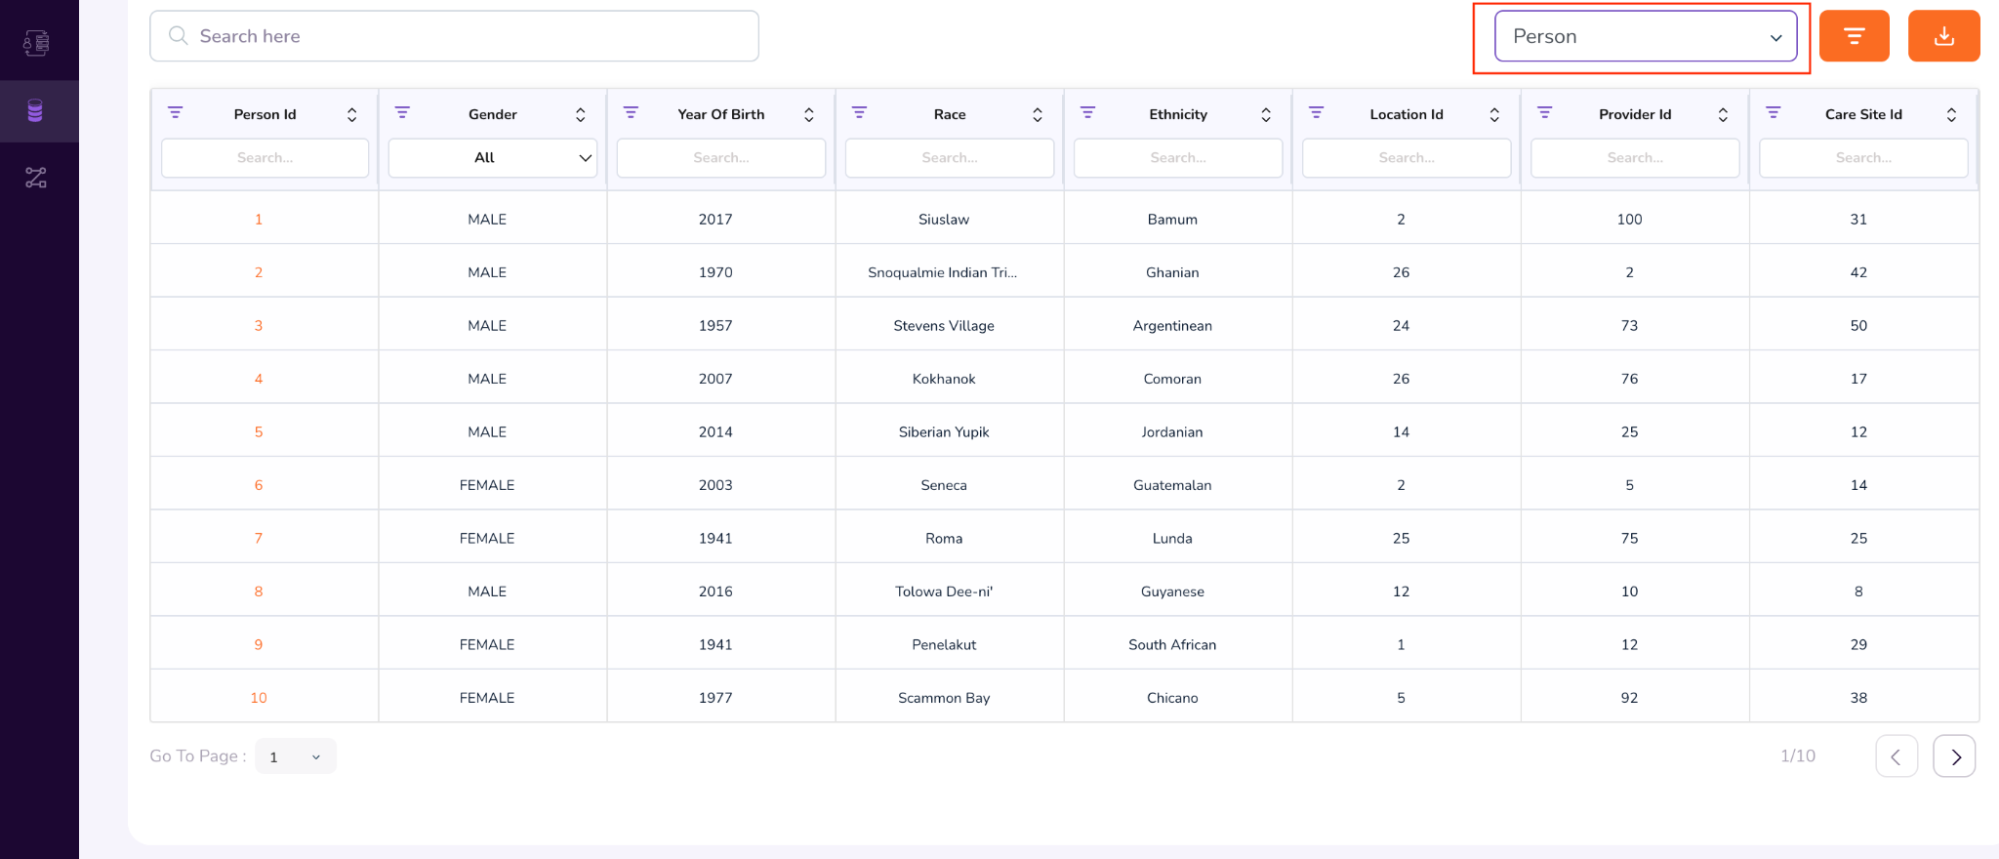
- We will first see an example of a Person Dashboard. In the above table, under the Person Id column, type 64. This will retrieve multiple rows with the same anonymized Person Id: 64.
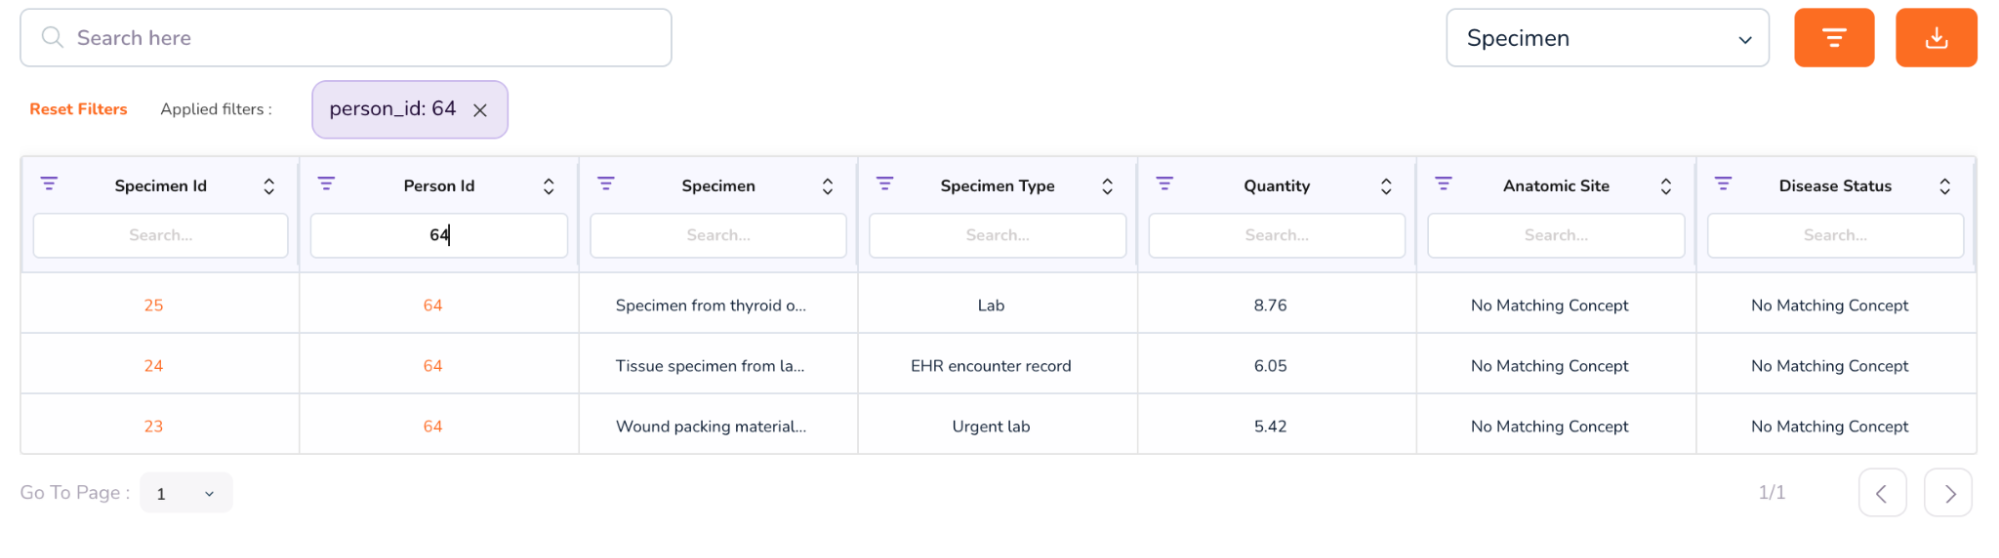
- Click on the number 64 in the Person Id column to access the Person Dashboard. This will open a new window, which looks as follows.
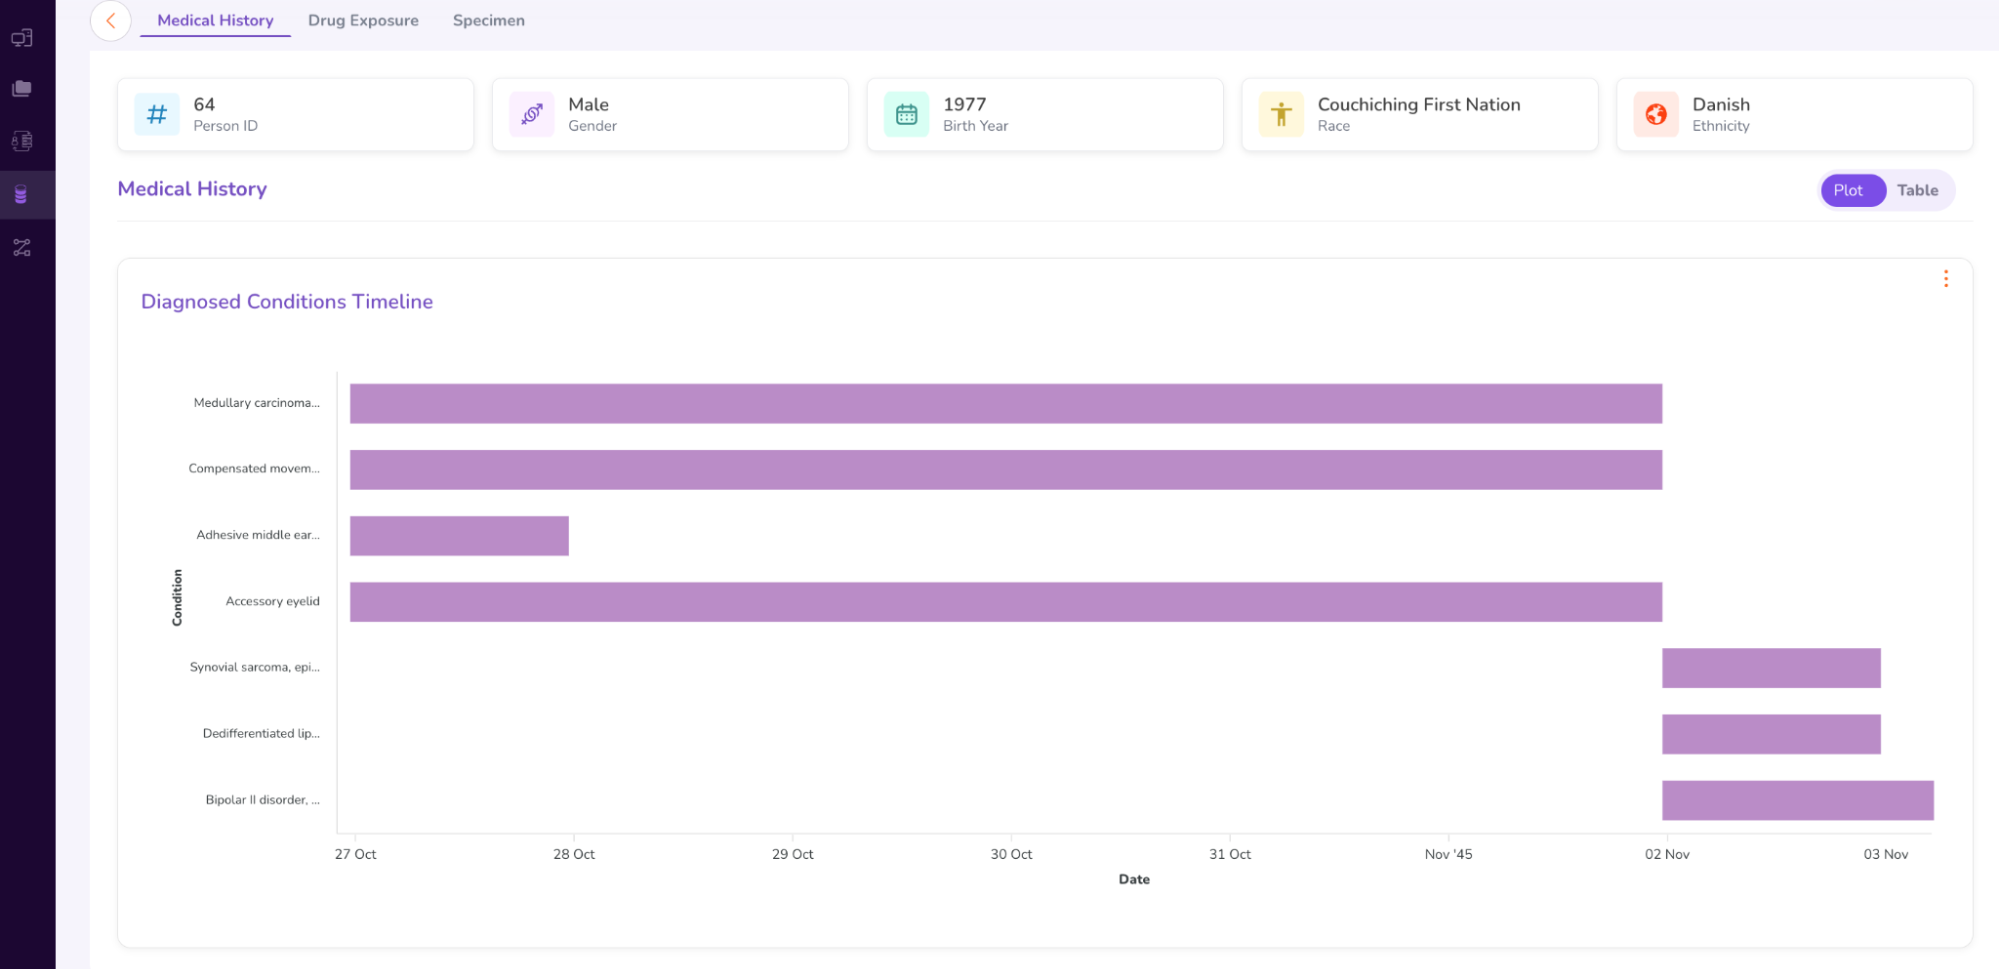
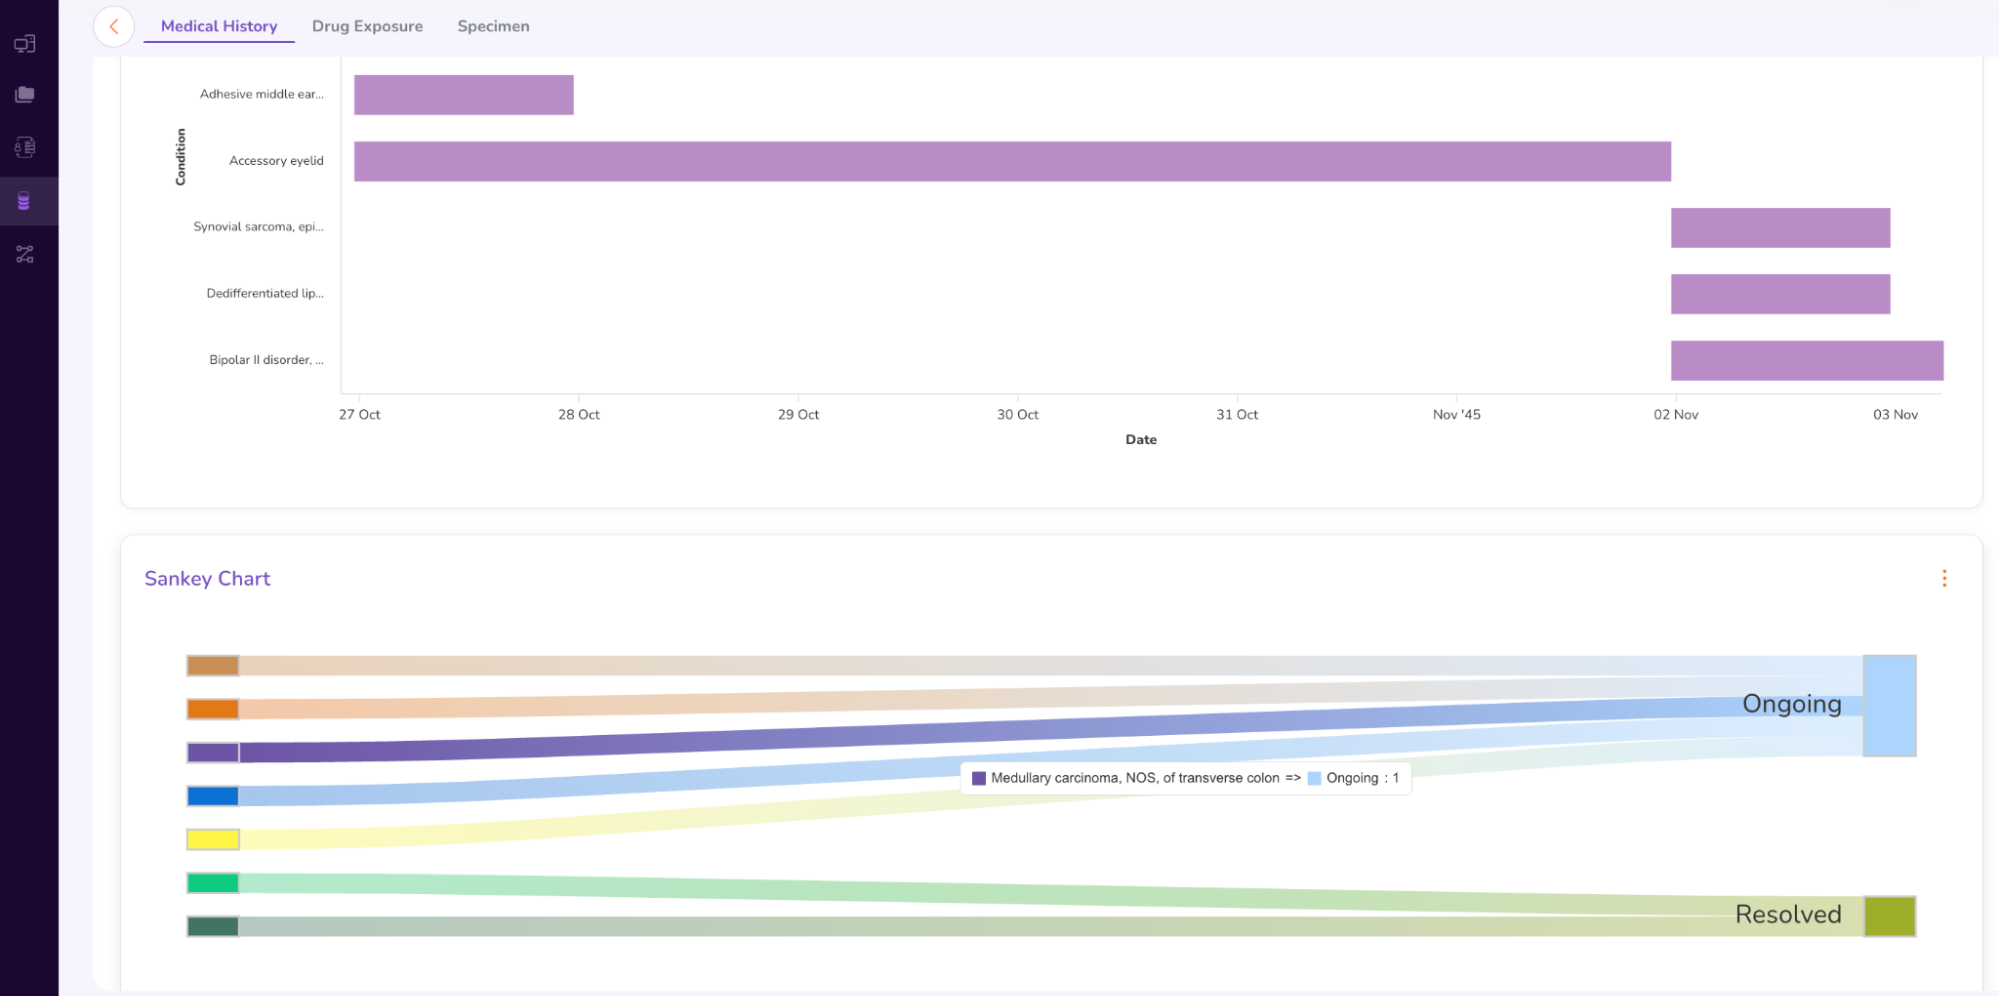
- The Person Dashboard displays the anonymized Medical History (including a Sankey Chart), Drug Exposure, and Specimen data (genomic sample data) of the patient.
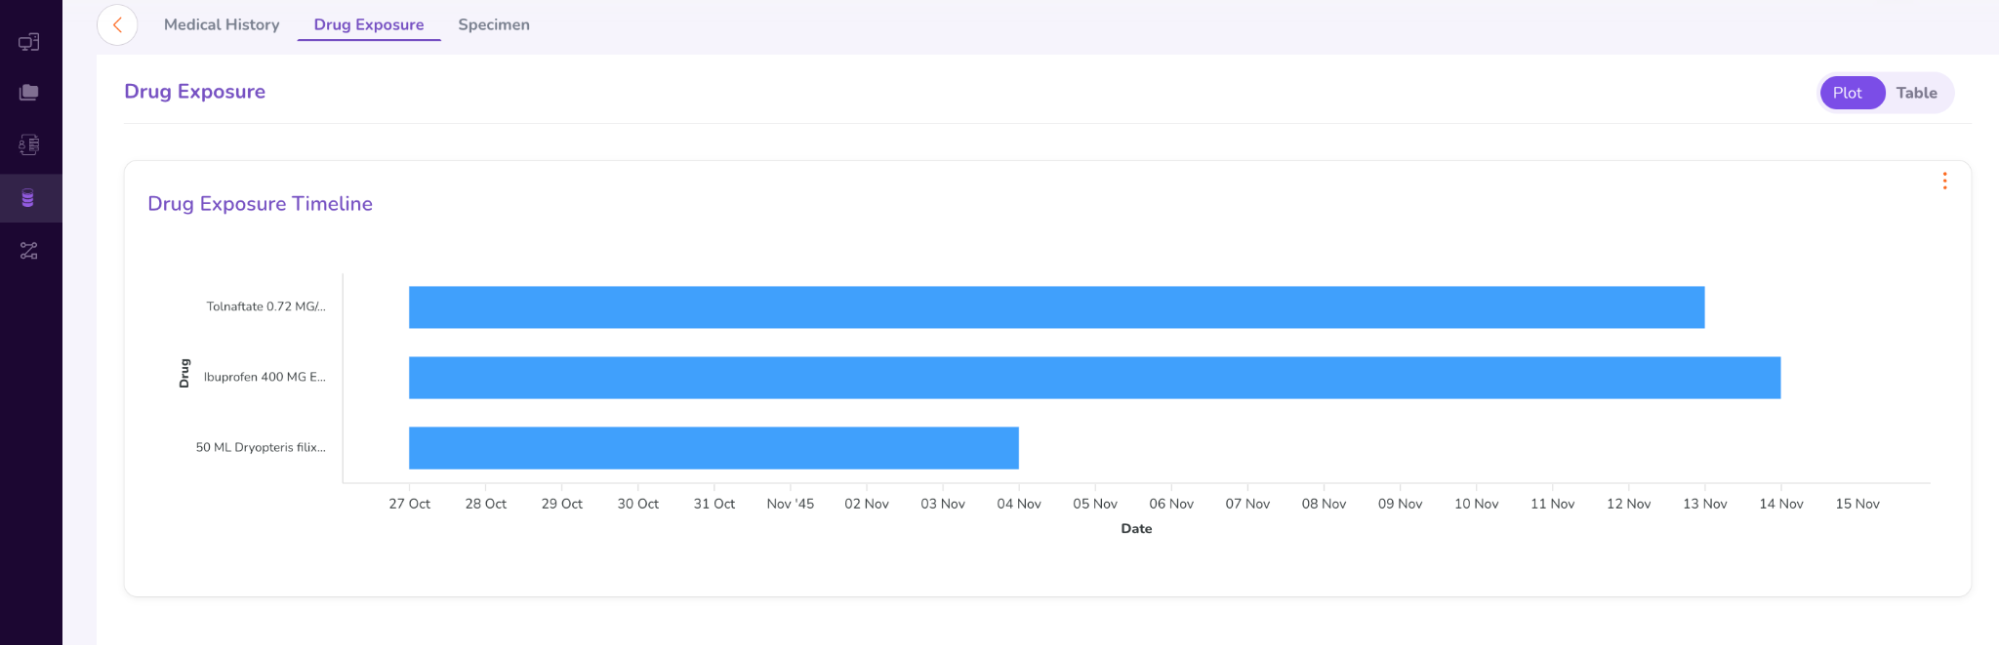
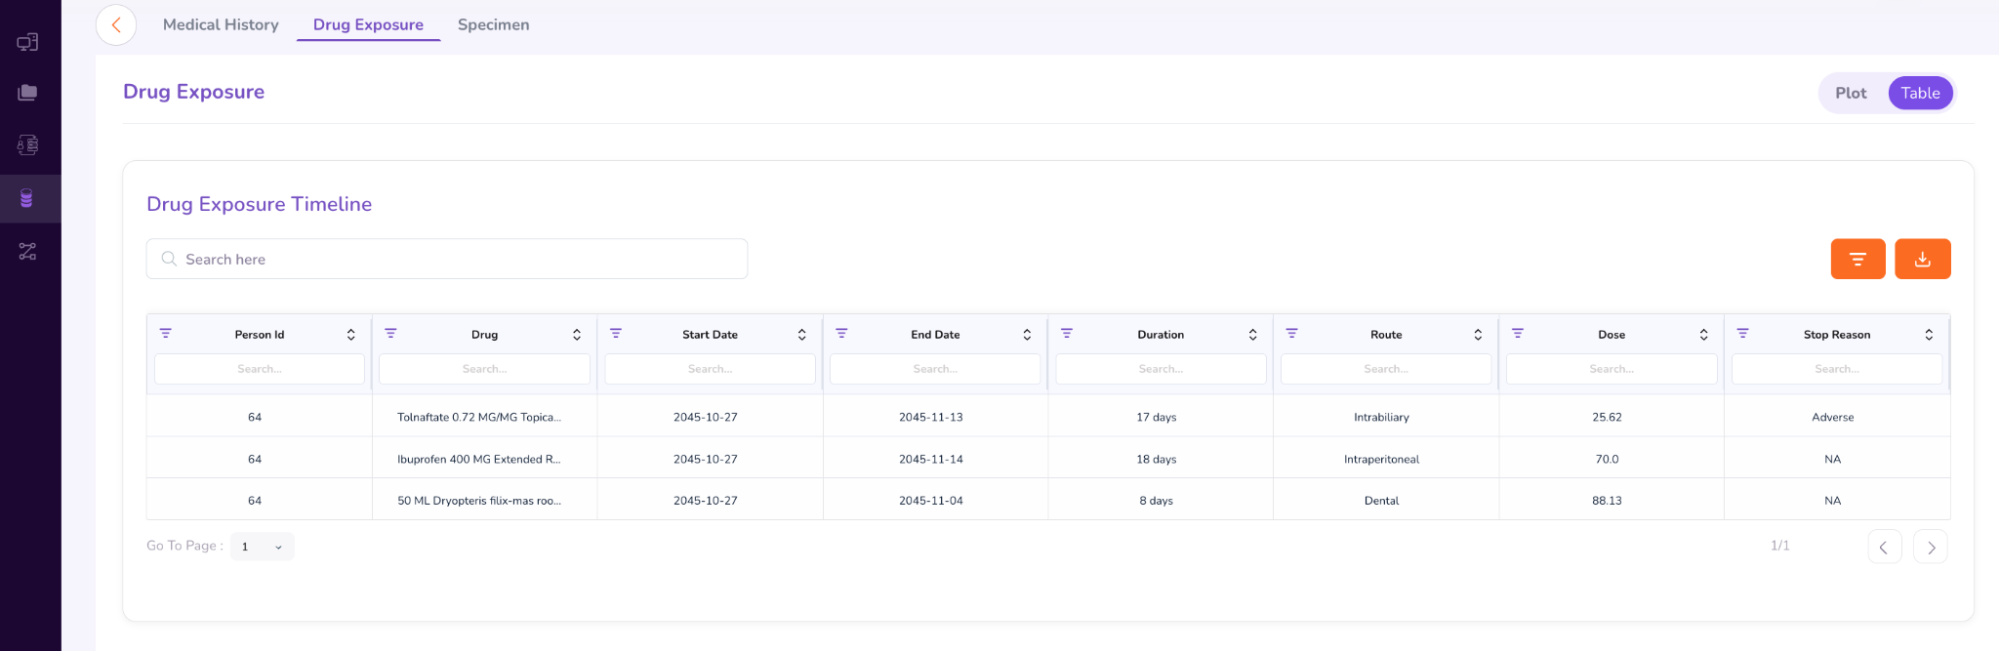
- You can select between “Plot” and “Table” options to view the patient’s drug exposure timeline.
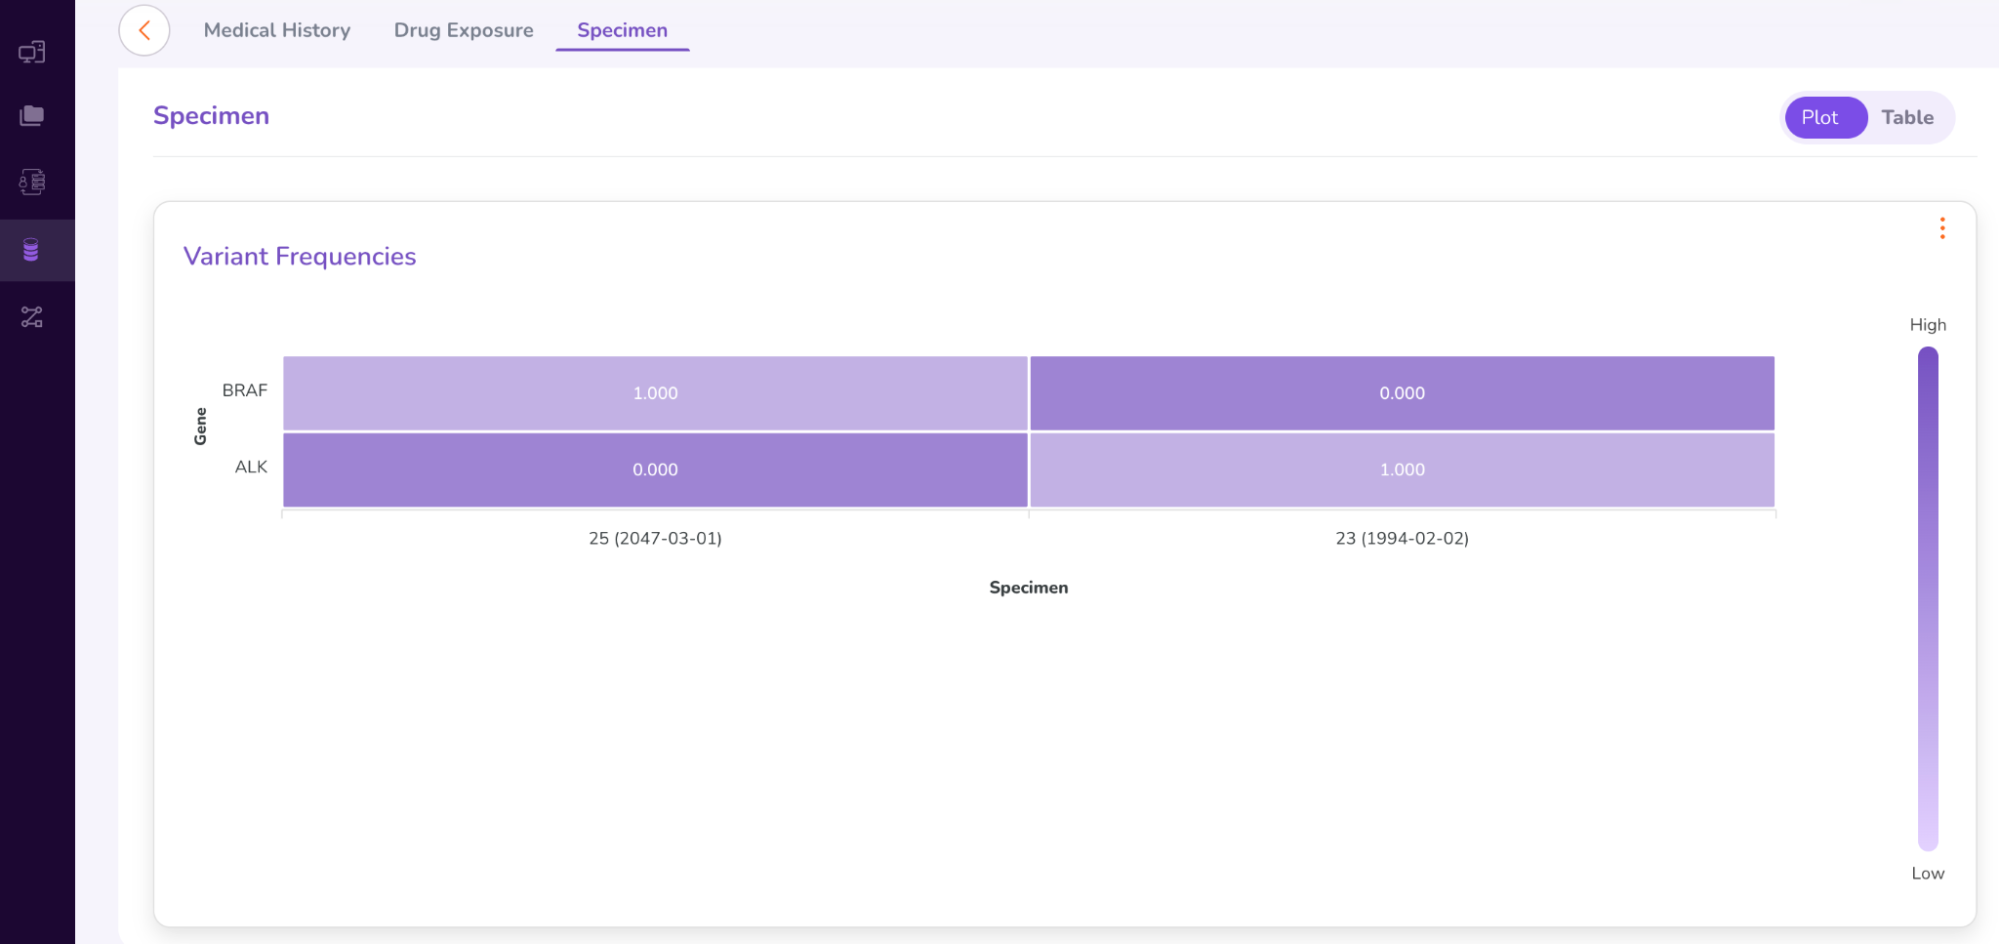
- The “Specimen” tab under the Person Dashboard gives a brief summary of the genomic variants found in the patient sample (as shown below).
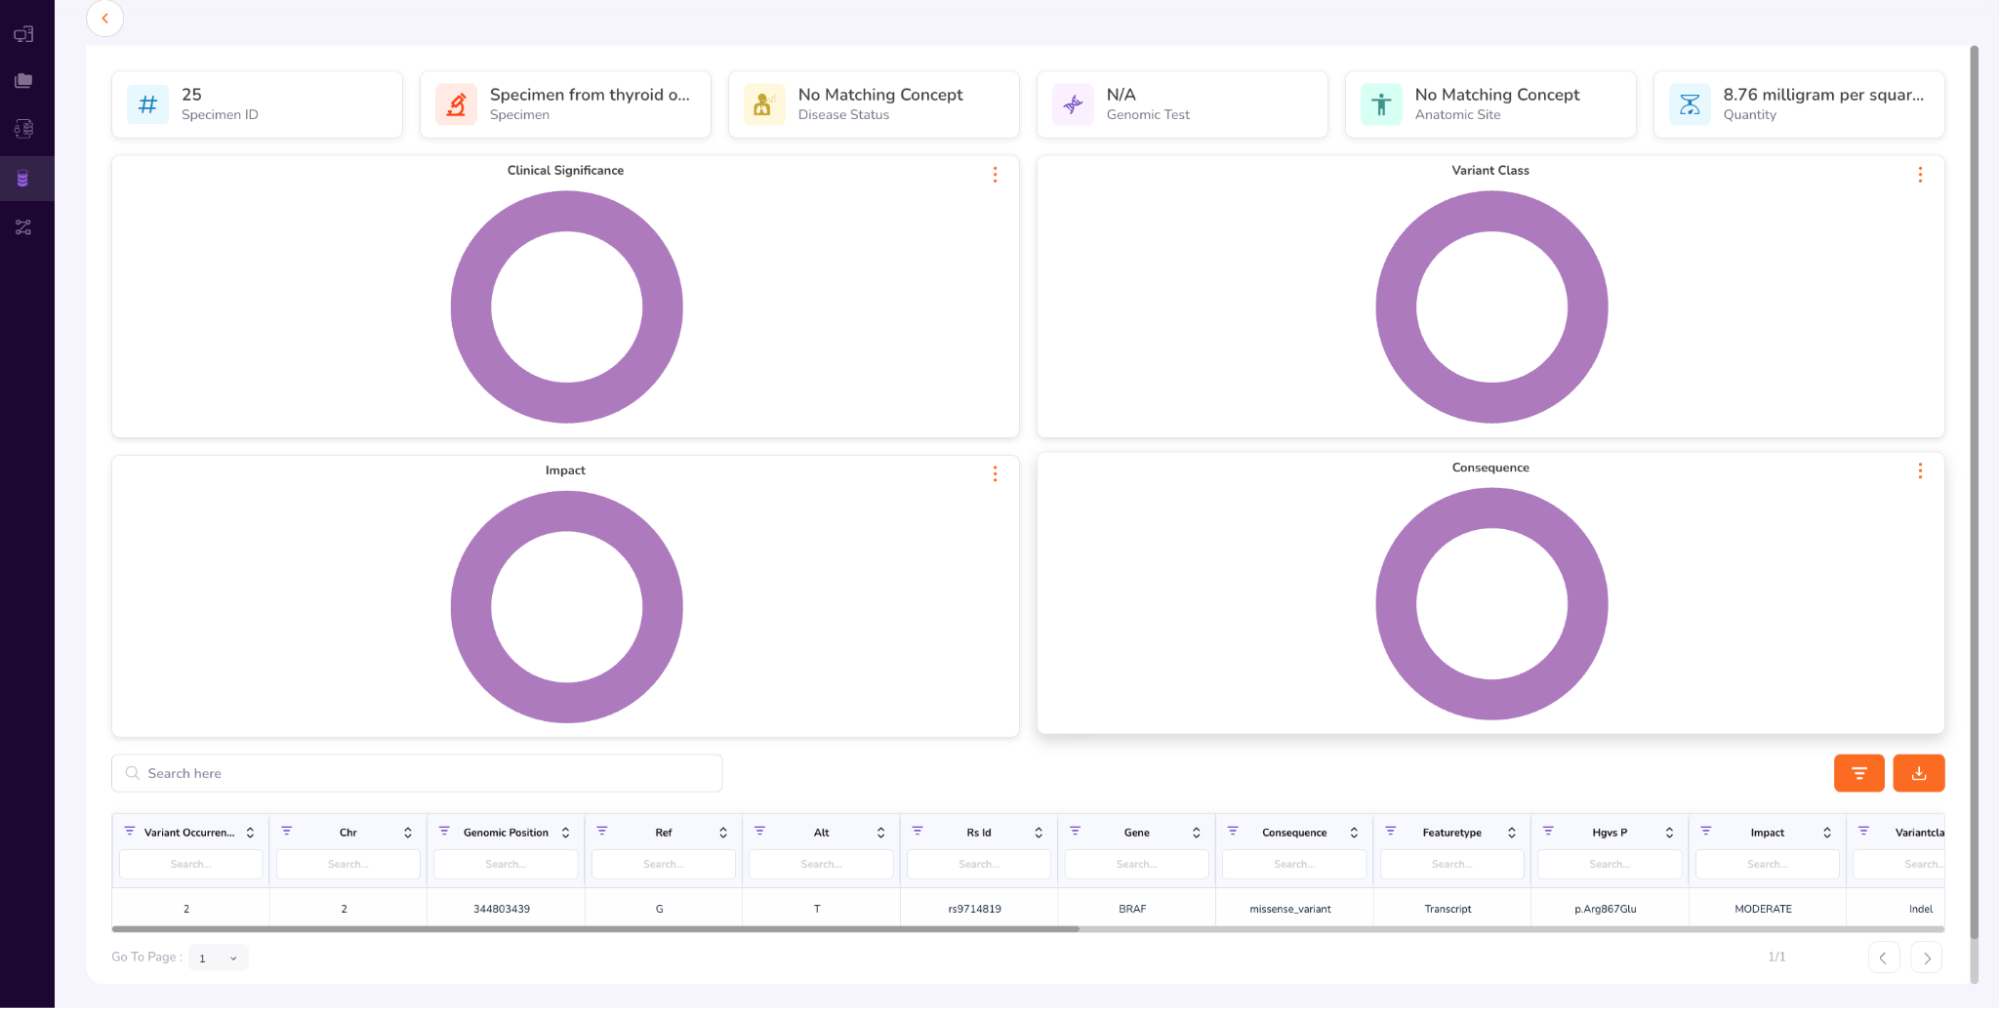
- To view the full Specimen Dashboard, close the above Patient Dashboard window. You will be taken back to the “Cohort Summary” Dashboard, with the Person and Specimen table at the bottom, showing Patient 64. Click the Specimen ID number: 25
- The Specimen Dashboard will open, as shown below. Browse the dashboard to view the Clinical Significance, Variant Class, Impact, Consequence. At the bottom of the dashboard is the Variant Occurrence table.
- Once you have completed browsing the Person and Specimen dashboards, go back to the main “Cohorts” screen by clicking “Datasets” on the left navigation pane. Your requested cohort will have been Approved (AFib_metoprolol_cohort). Confirm “Approved” status and next click “Workstations” on the left Navigation Pane.
Step 6: Request Workstations
- Navigate to Workstations, where users can create and request access to workstations equipped with the necessary operating systems and software, such as Rstudio and Jupyter Lab.
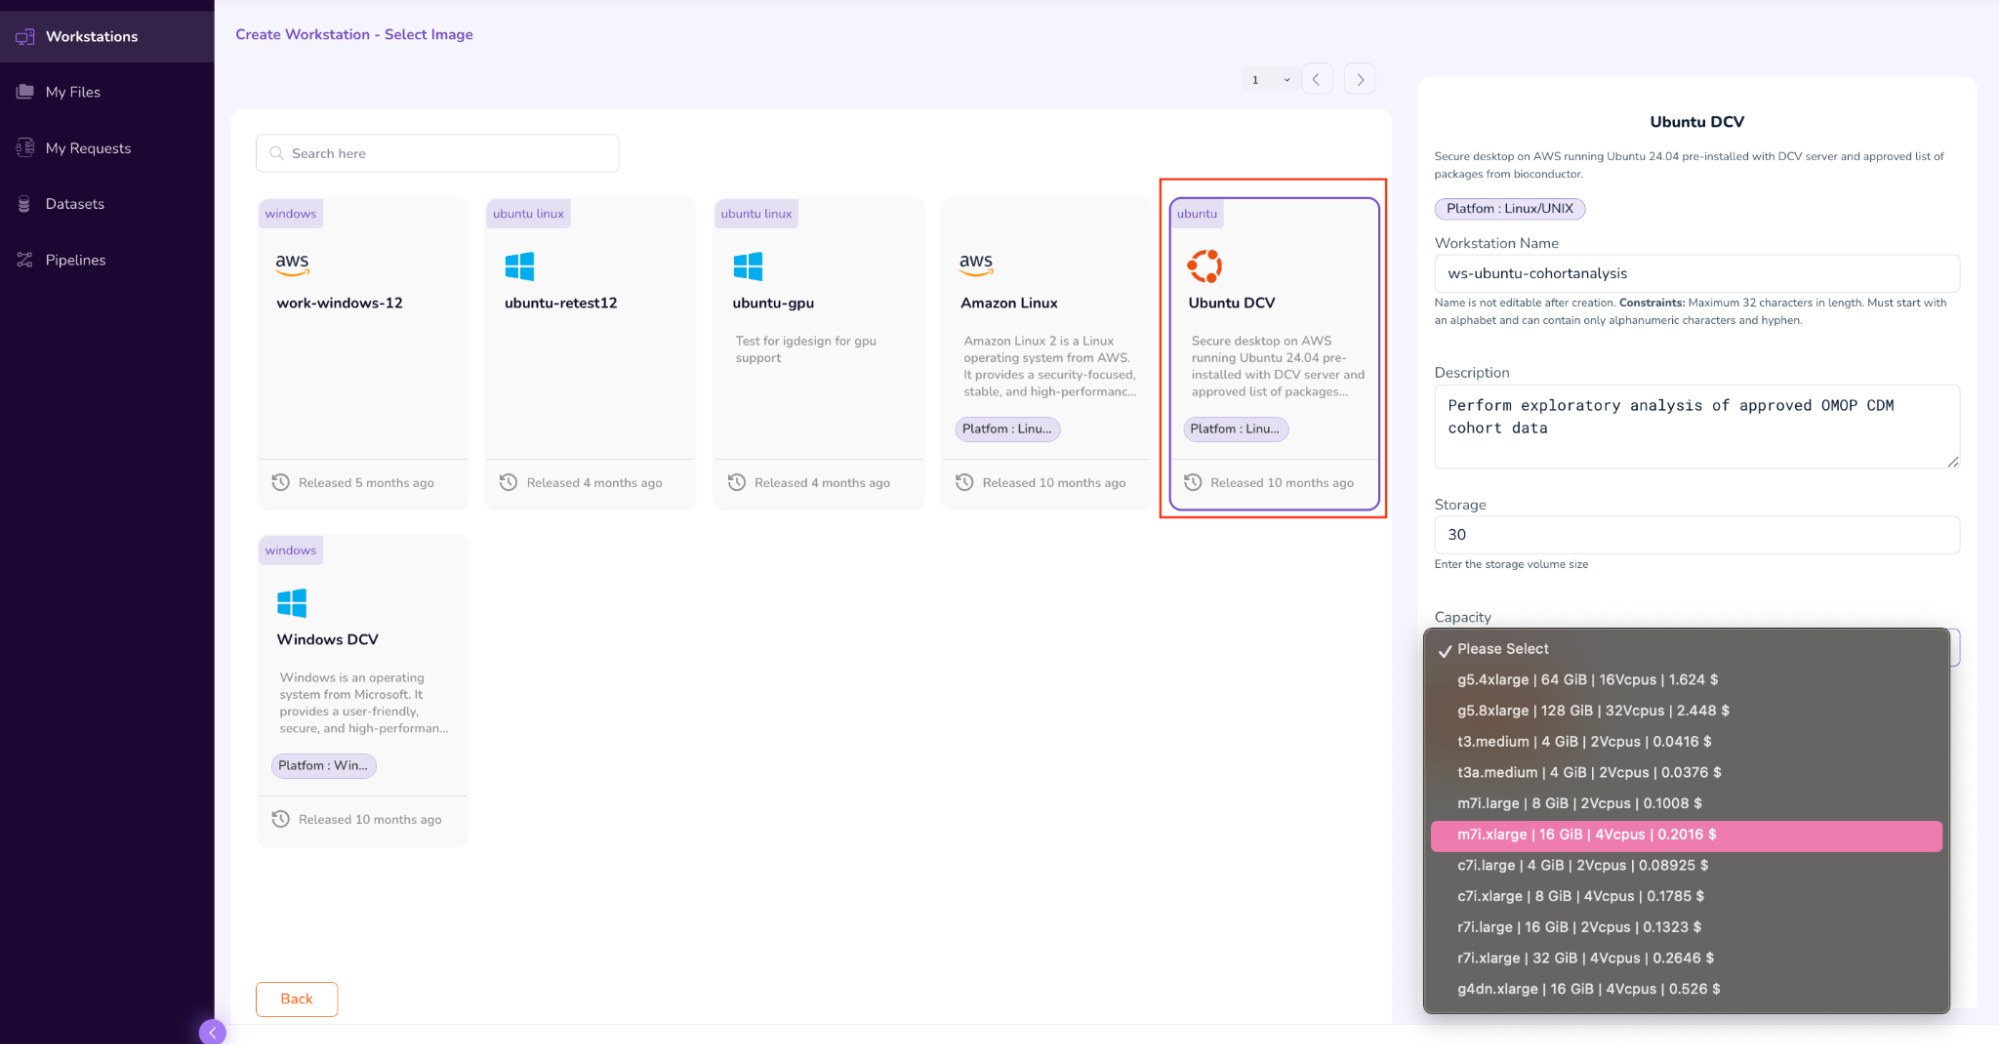
- Click “Add New” on the top-right corner of the screen.
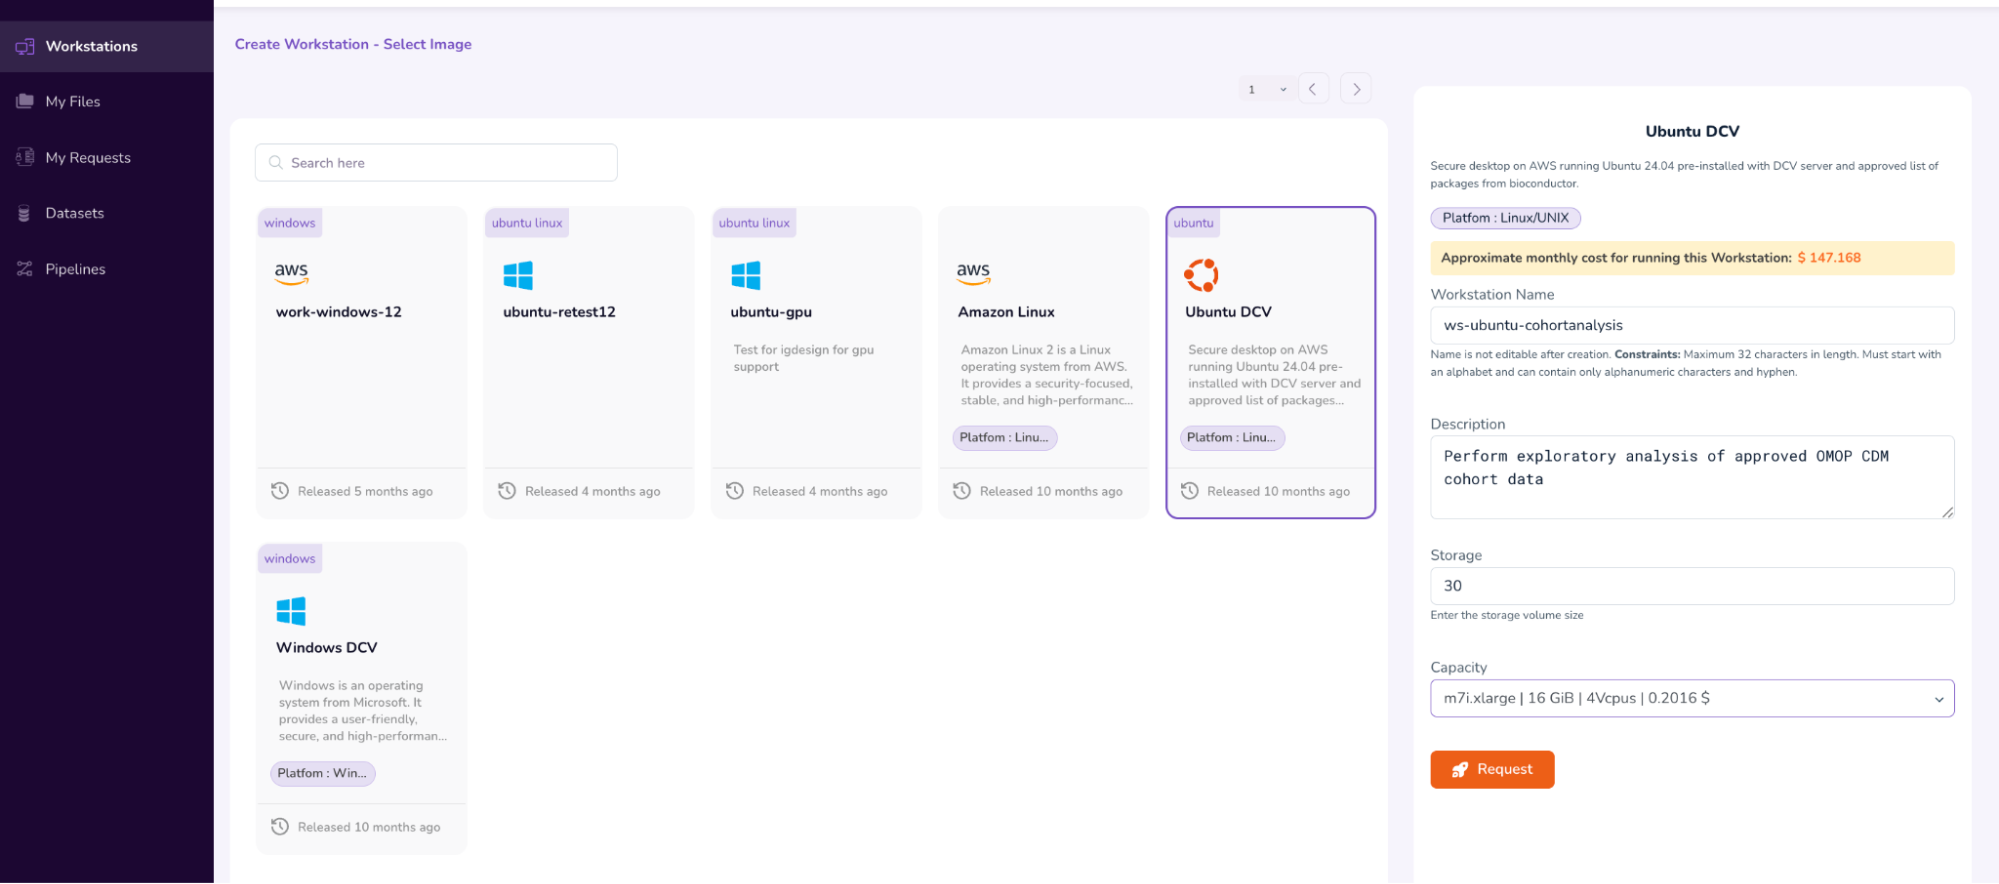
- Select the “Ubuntu DCV” Image. On the left pop-up pane, fill in the “Workstation Name” (ws-ubuntu-cohortanalysis), Description, Storage (30), and Capacity (m7i.xLarge | 16 GiB | 4Vcpus |).
- After verifying the parameters, submit the Workstation access request by clicking the “Request” icon, and then selecting “Submit”. This will initiate the Workstation Approval flow.
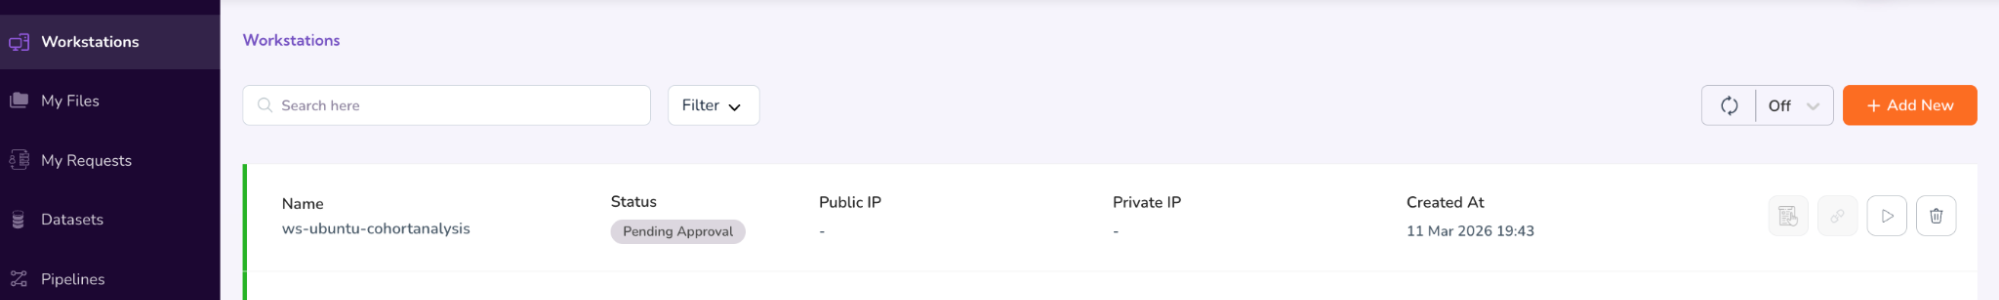
- This will take you back to the main Workstations screen, where you will see that your access request is “Pending Approval.”
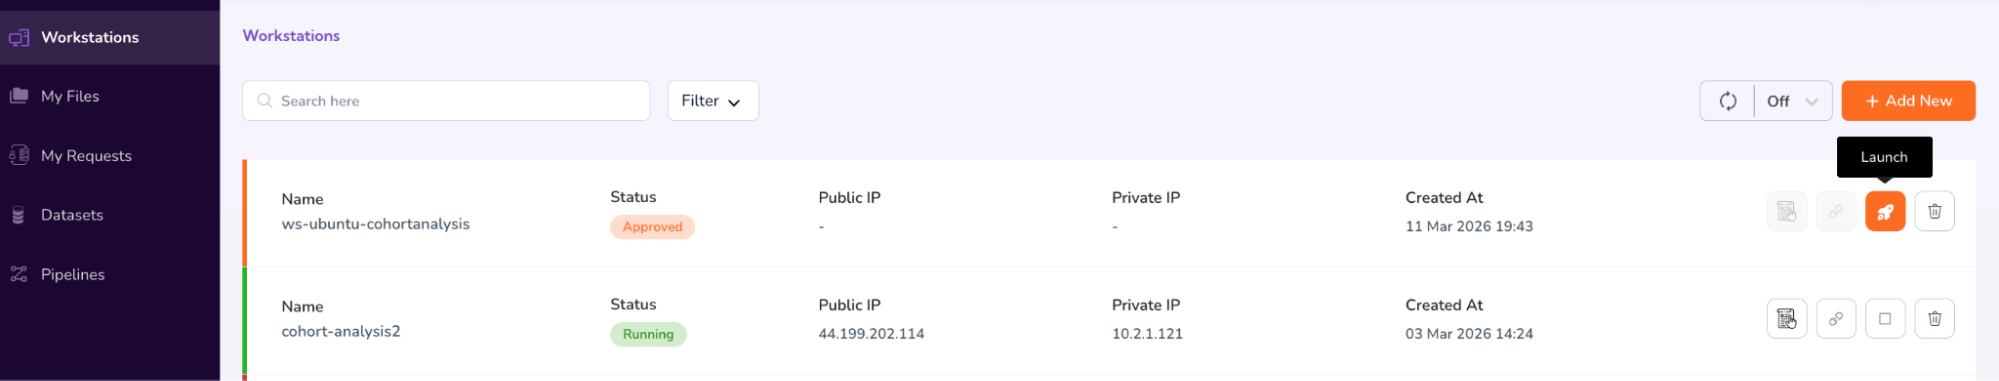
Step 7: Connect to Workstations
- View the Approval status of your workstation. Once it’s Approved, click on the “Launch” icon to launch and connect to your workstation.
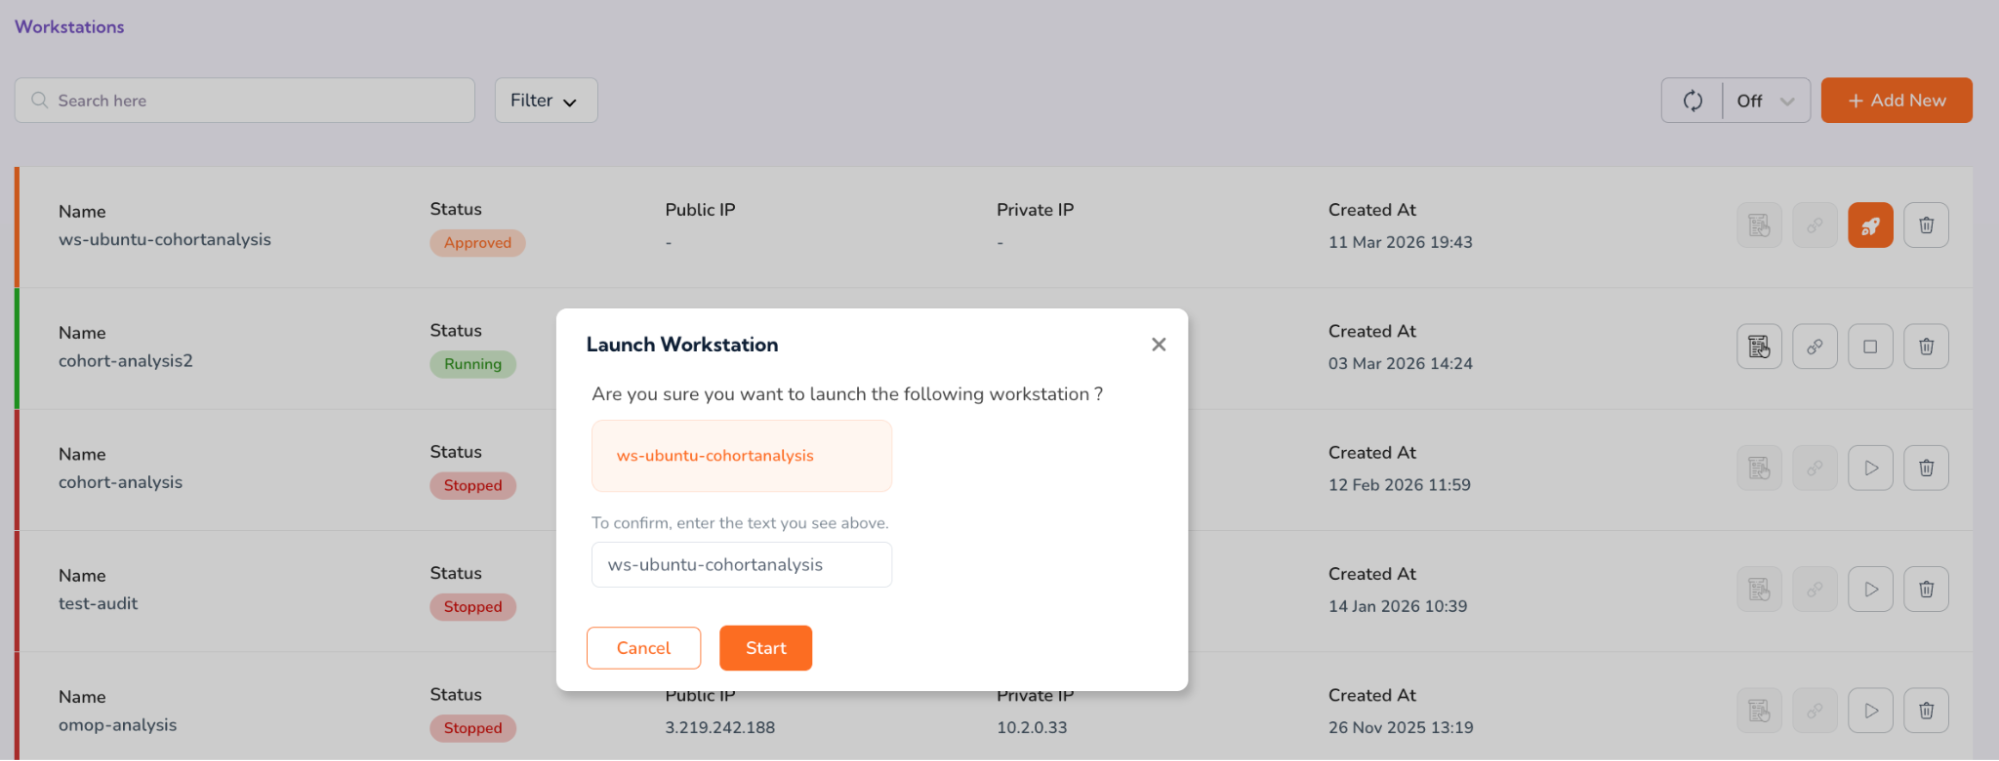
- You will be prompted to confirm the launch. Copy the prompt text and paste into the verification box to confirm, and click “Start.”
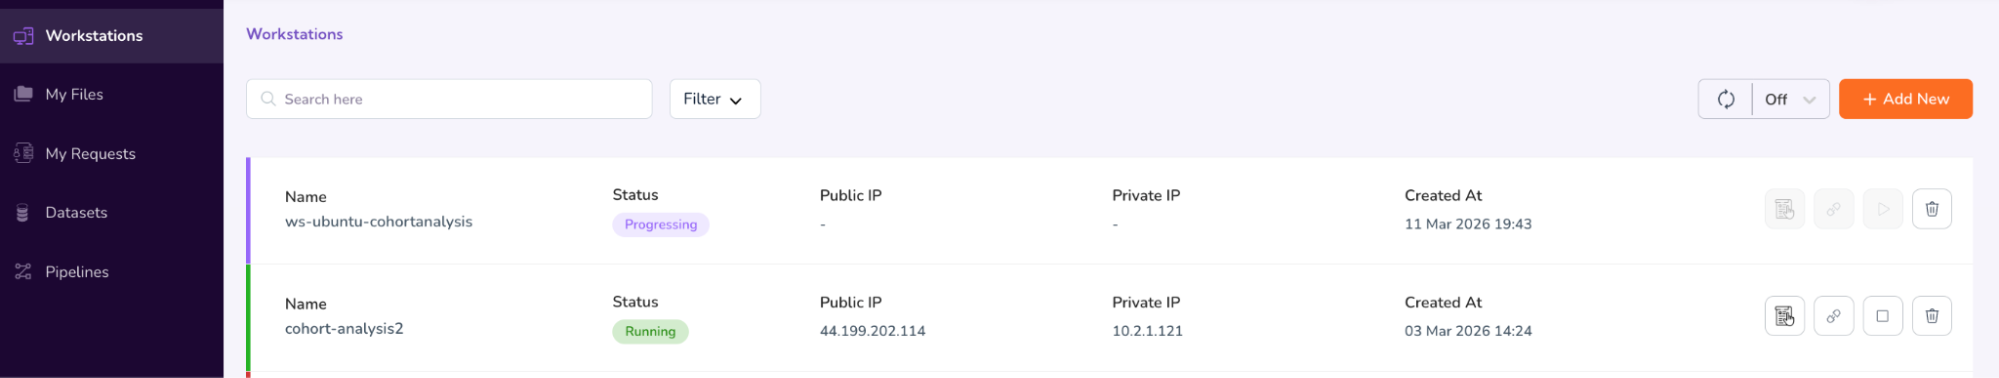
- You will see that your workstation status will now be updated to “Progressing”.
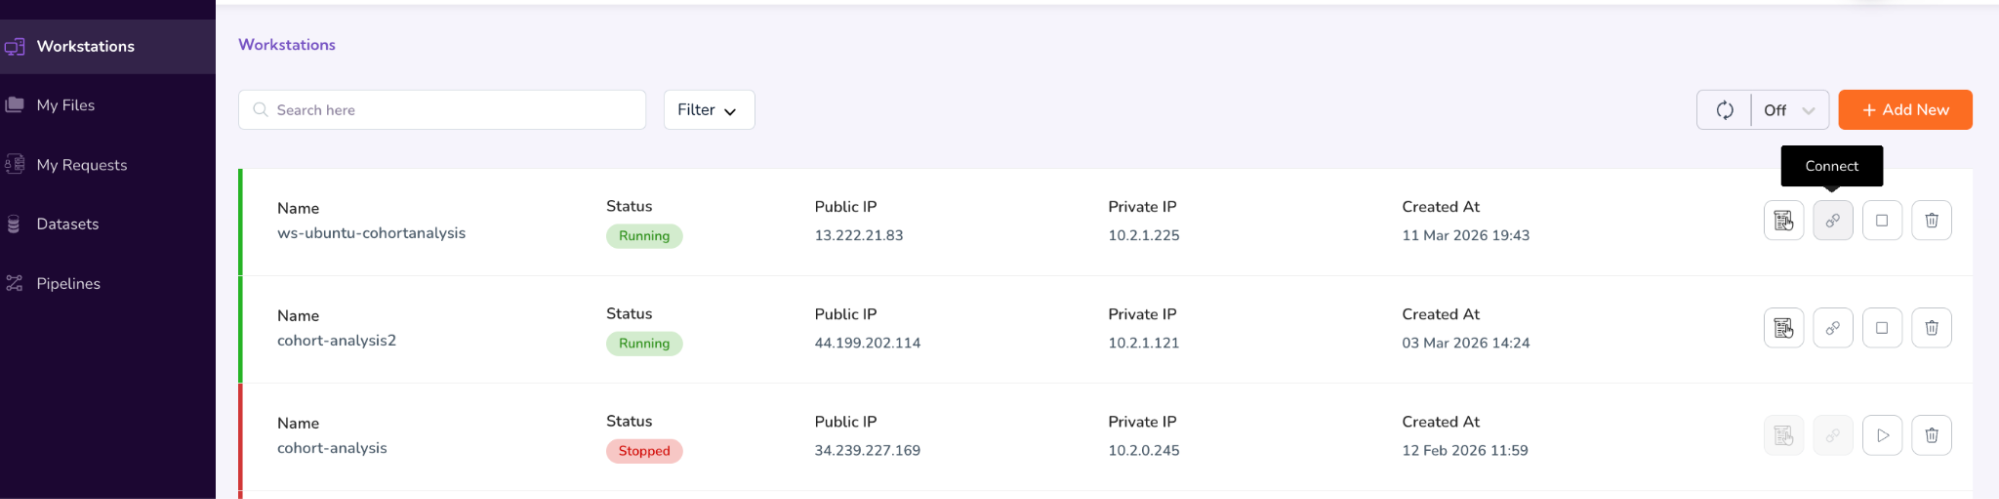
- Once the status updates to “Running,” click the “Connect” icon.
- This will connect to your workstation in a new window. Enter the username as: ubuntu
- For retrieving the password, open the previous Workstations Window and click on your workstation name (“ws-ubuntu-cohortanalysis”). This will open a pop-up screen on the right, which will list details about your Workstation, including the Password in the last row[b].
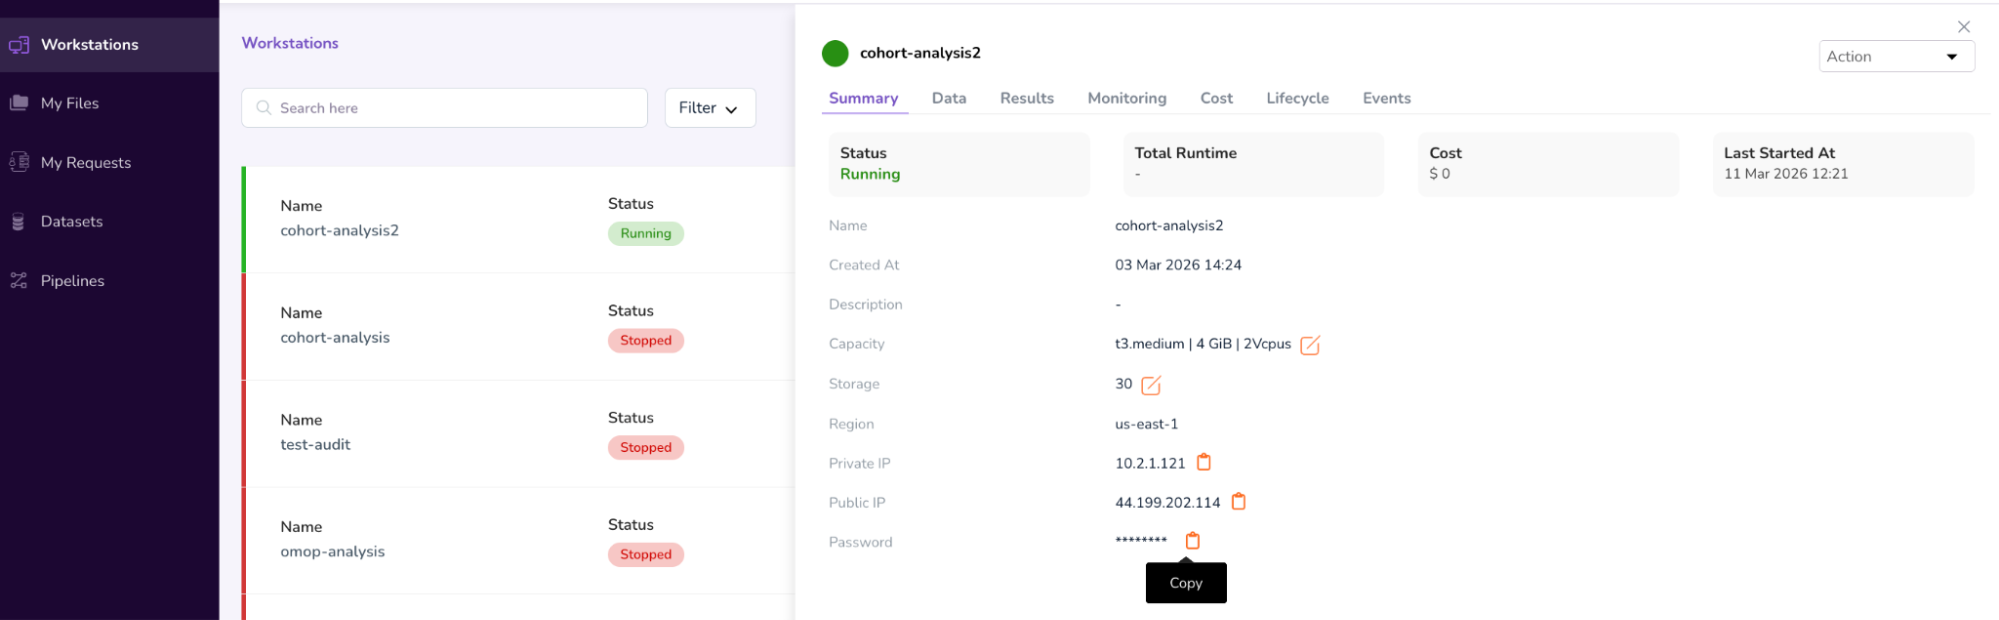
- Click on the “Copy” icon next to the password. Go to the Workstations screen and paste the password, to Sign In.
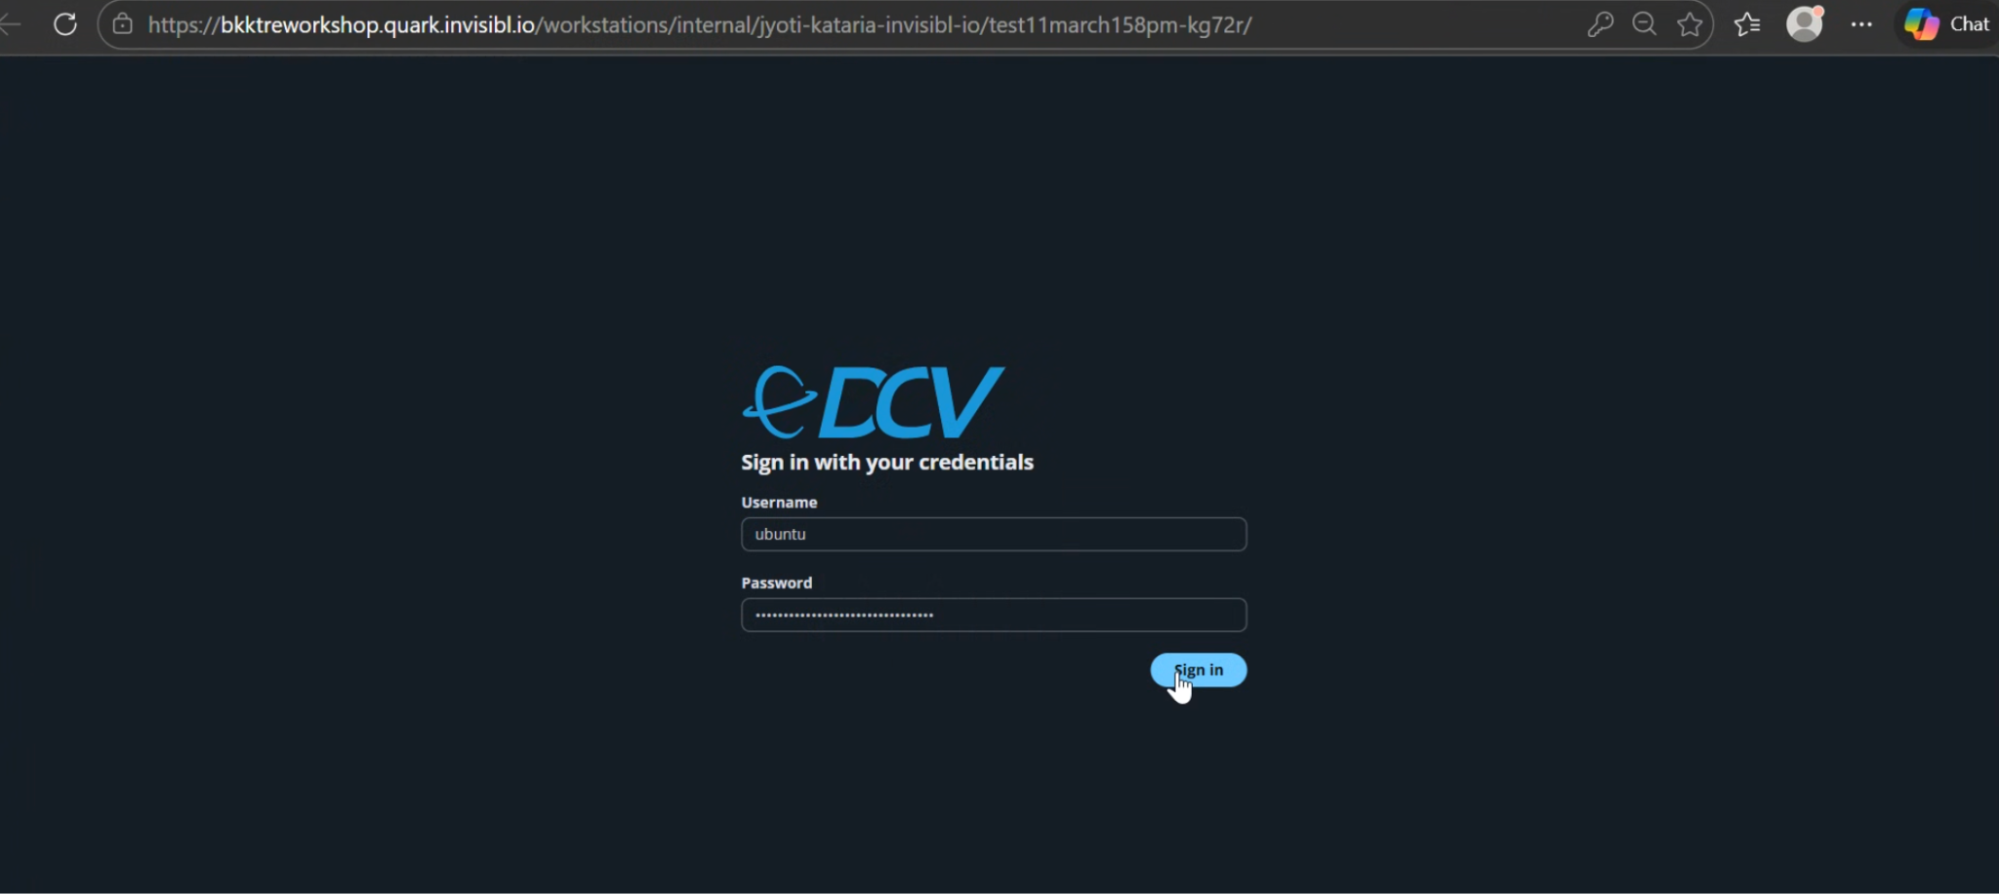
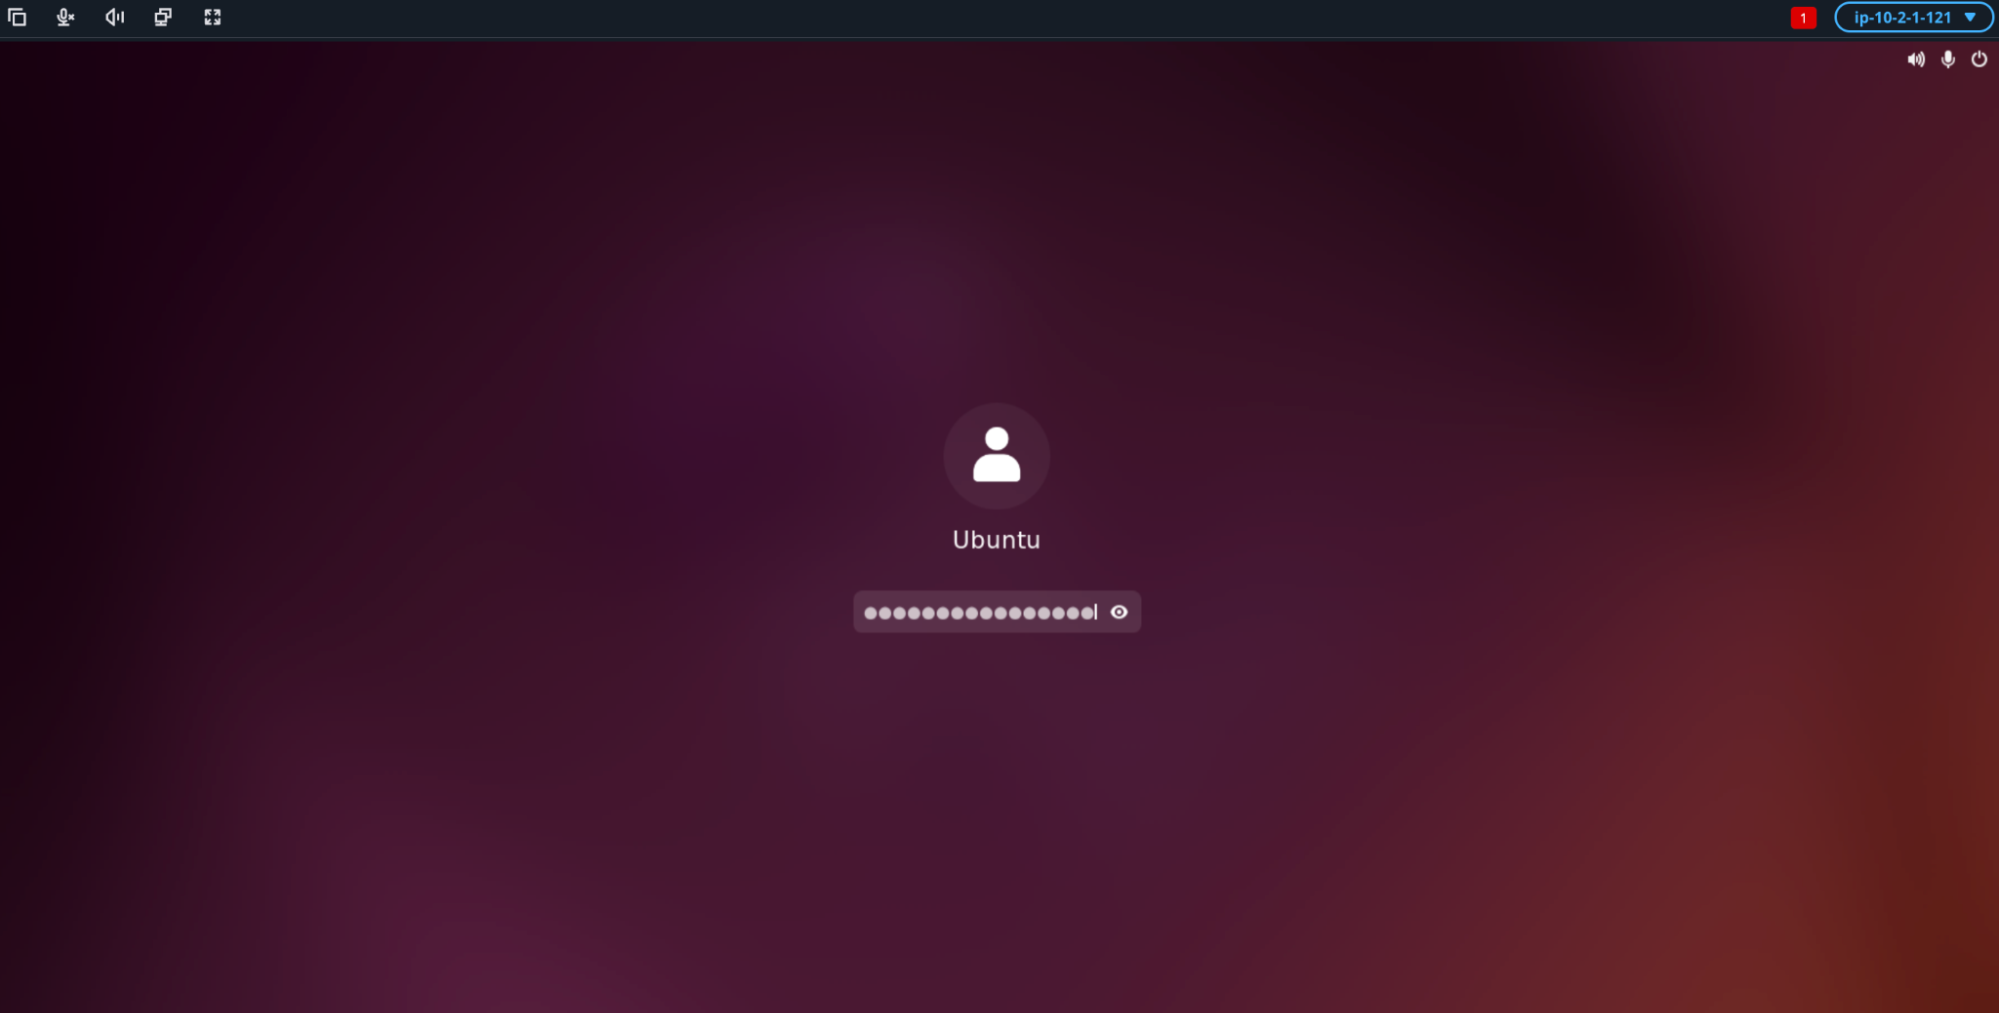
- Click the screen, and re-enter the password when prompted.
Step 8: Open Jupyter Lab
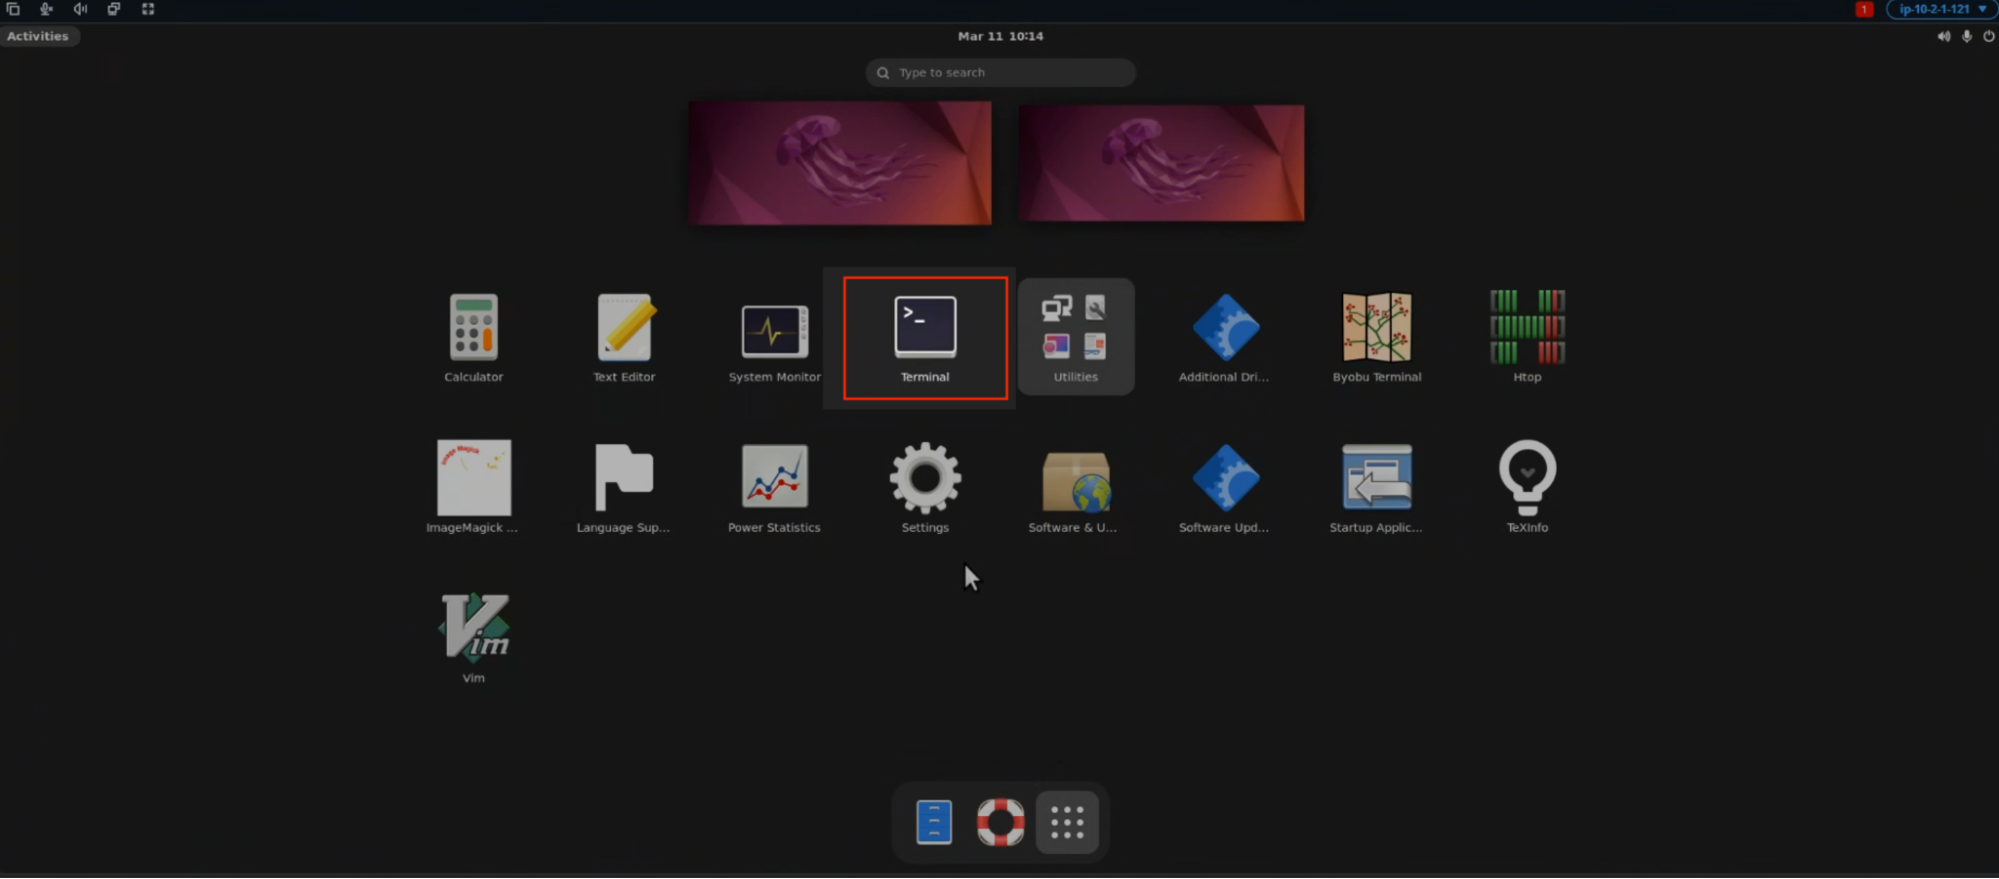
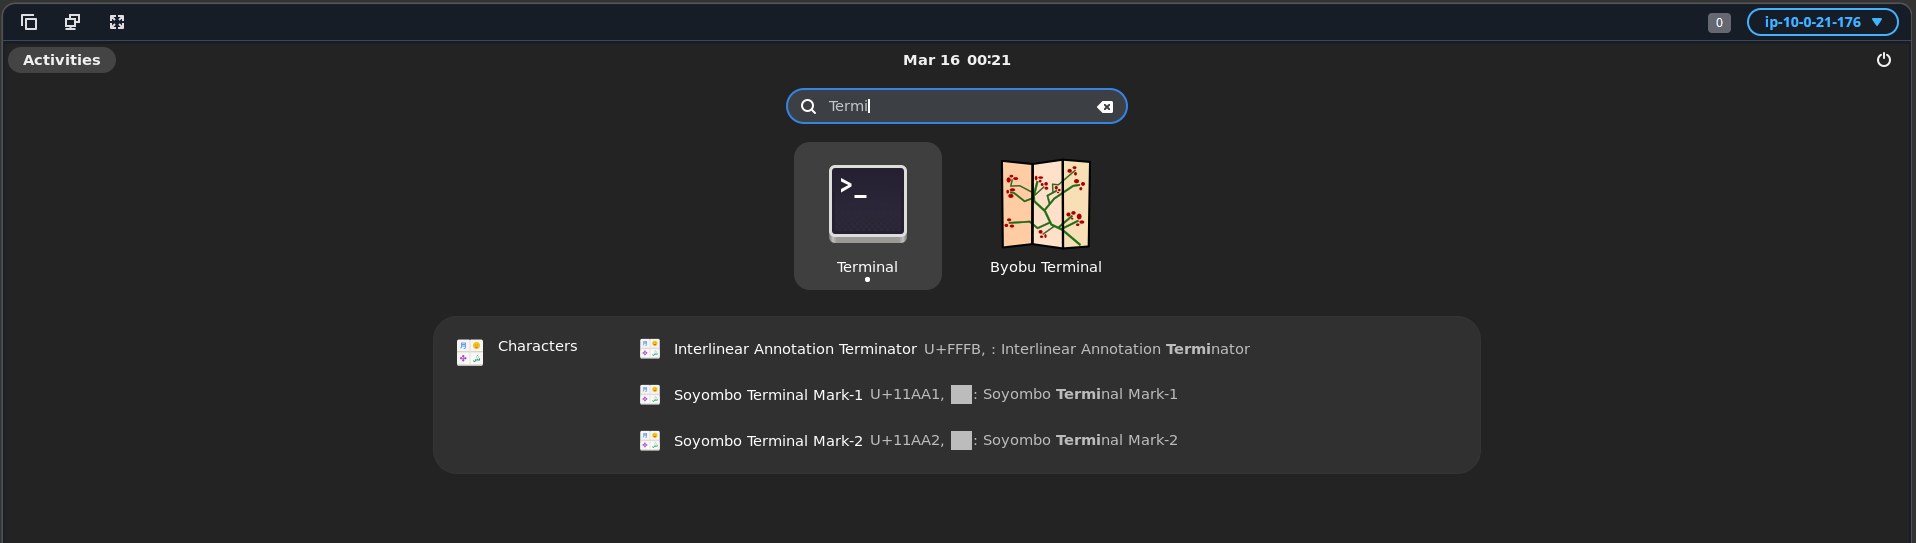
- Once you have connected to the workstation, click the Activities button in the top-left corner of the screen. Then open the Terminal either by selecting the Terminal icon as shown below or by typing “Terminal” in the search bar.
OR
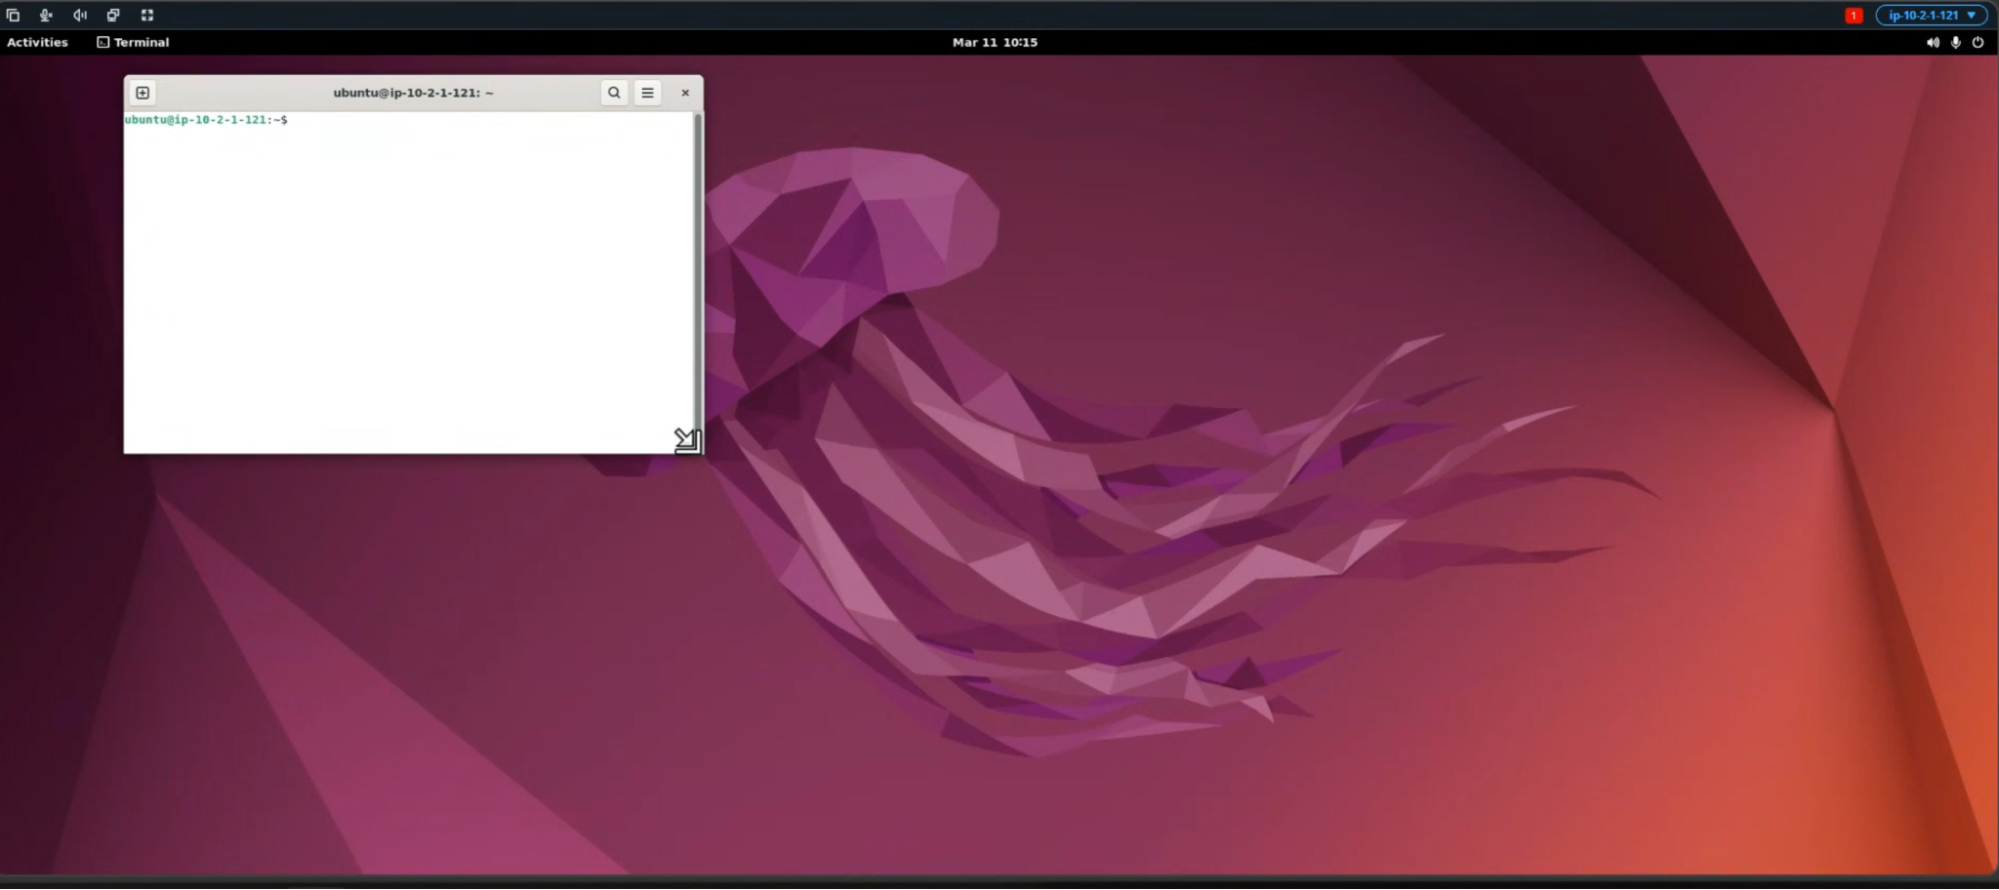
A terminal window will open as shown below.
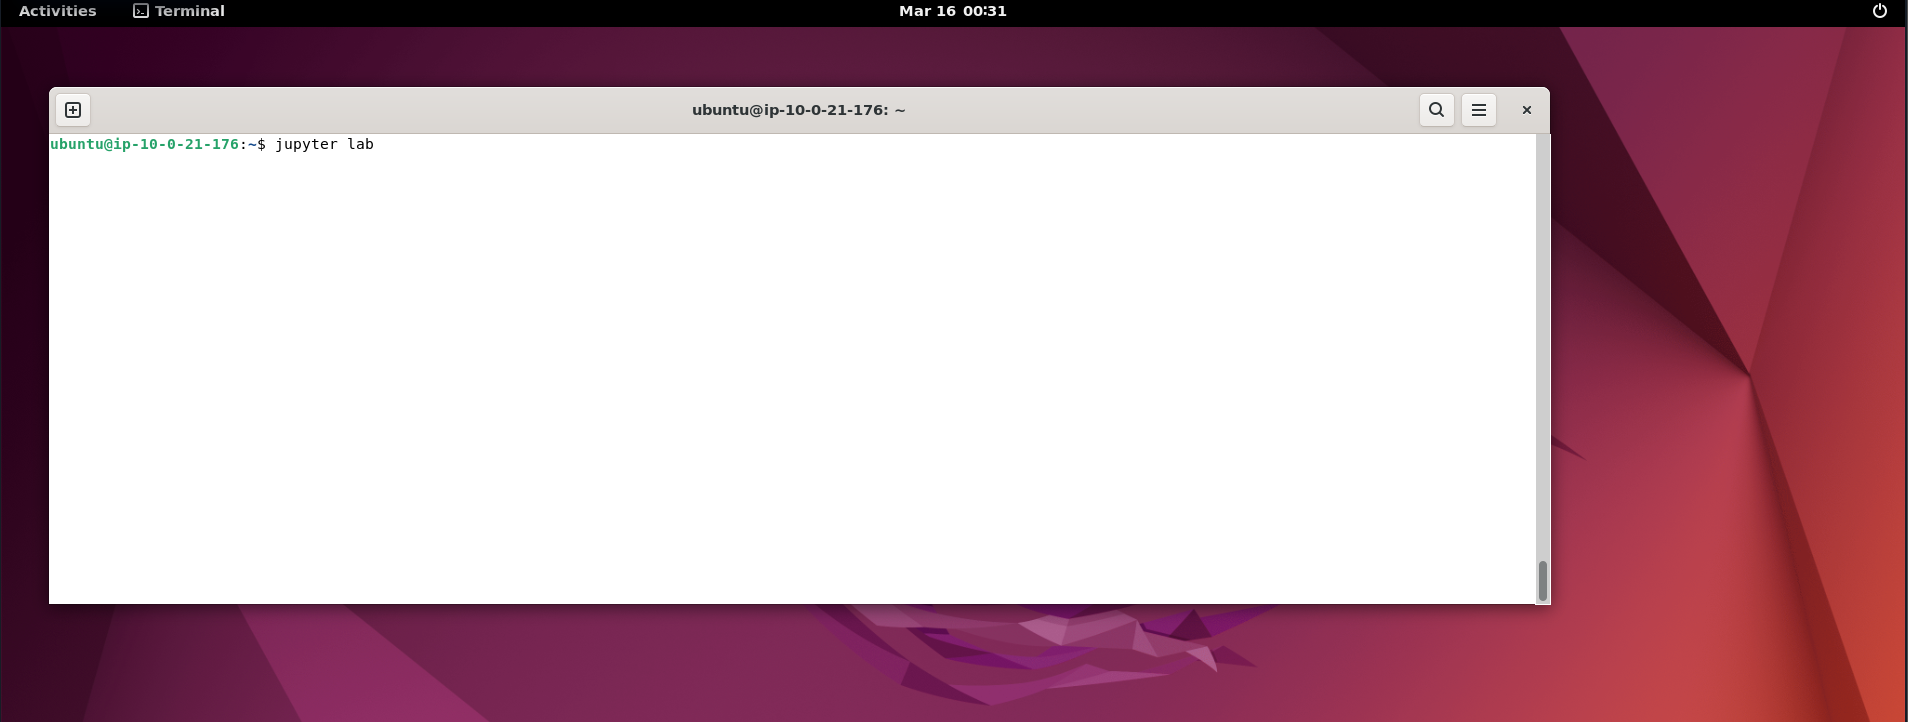
This will open up the jupyter lab window for you as shown below.
- Navigate to the folder icon on the left to open the pre-uploaded analysis notebook named “Hands_On_Sess[h]
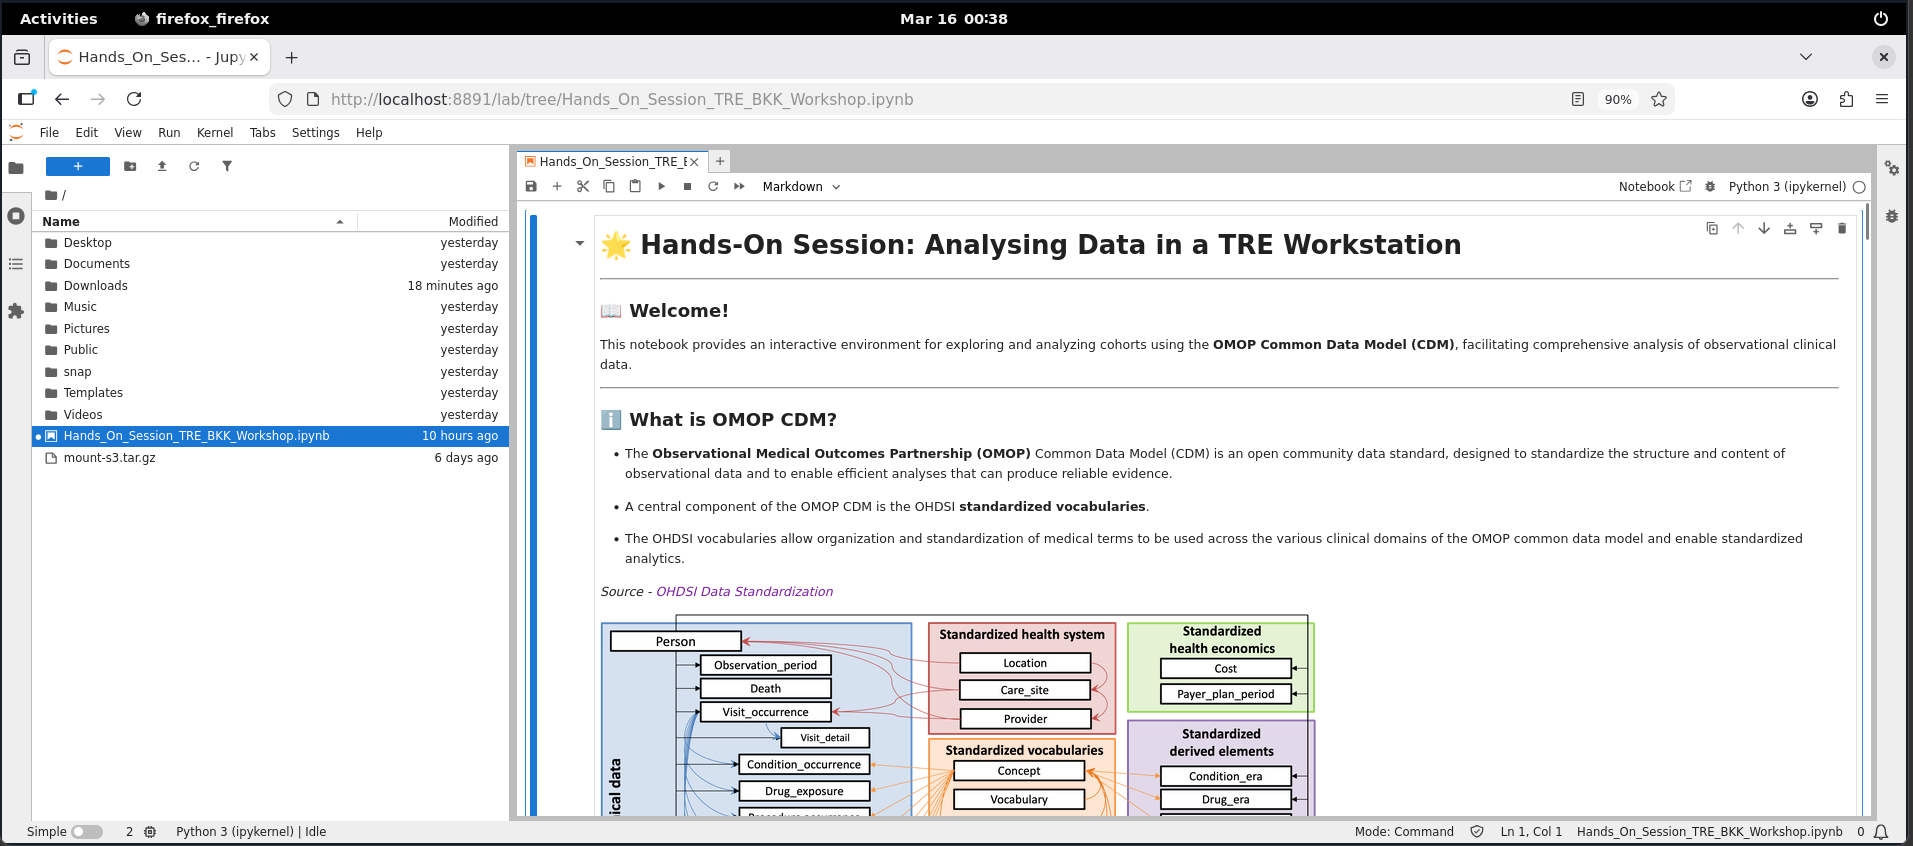
👉 “Congratulations! You are now equipped with the armor to analyze the data.” 🛡️
Step 9: Run Script Blocks
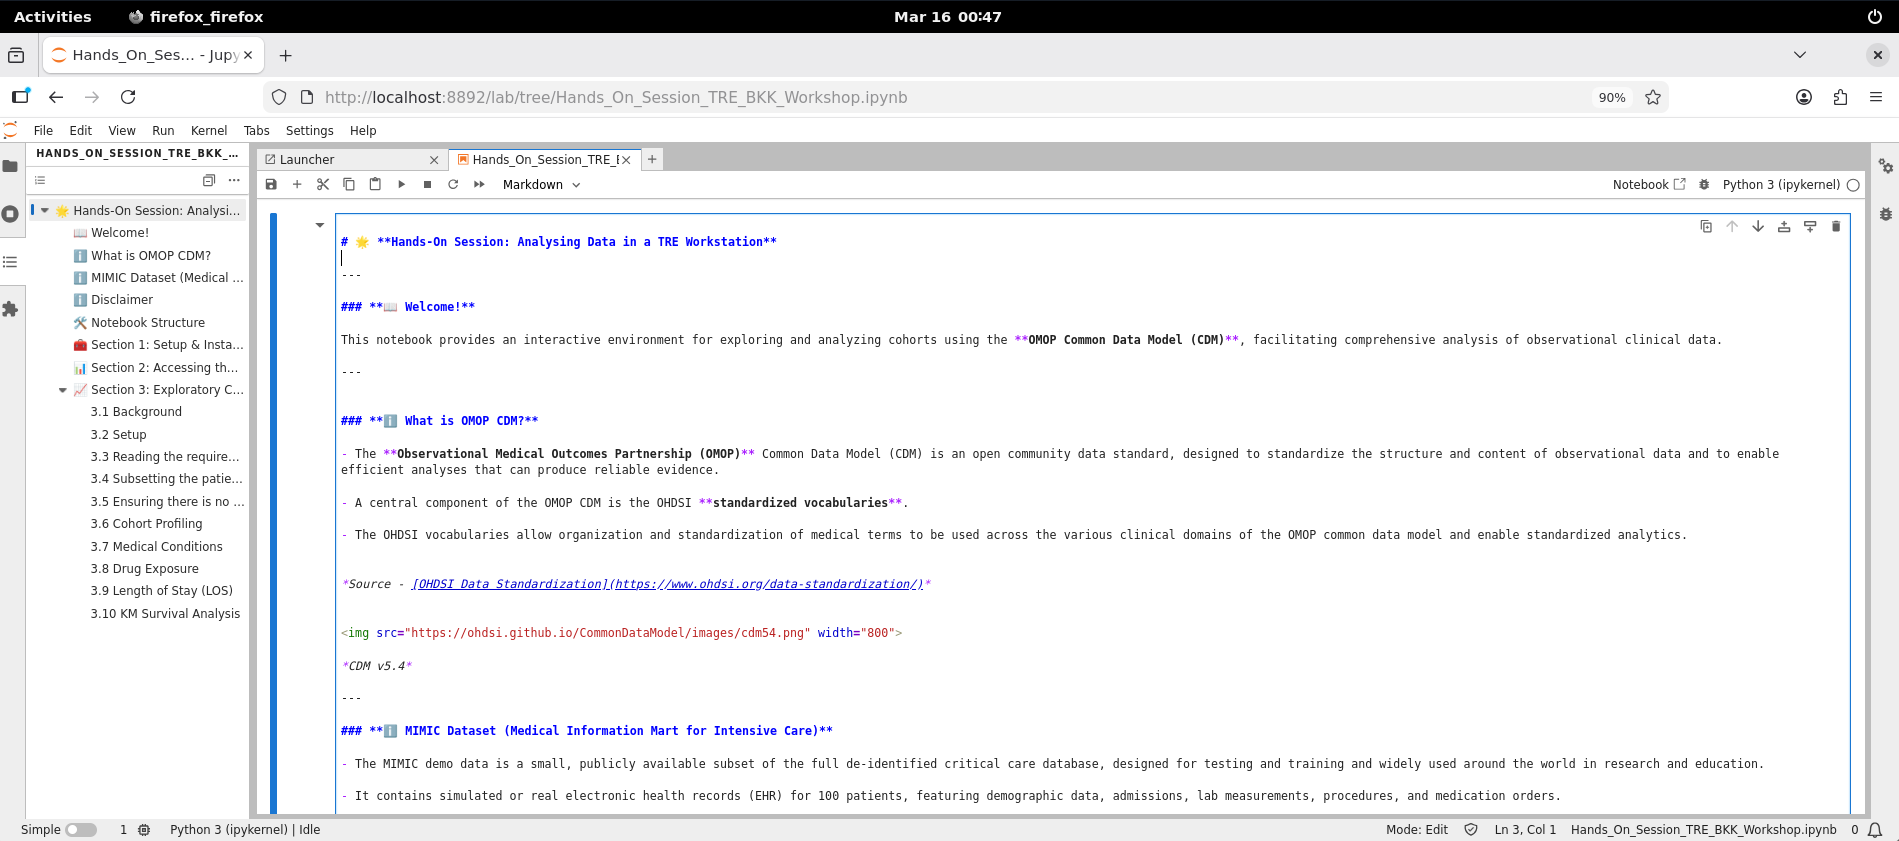
- Scroll down to the First Code Block. Click within the block to select it.
-
Once you have selected the code block, click the Run (Play) ic[i]on at the top of the screen. Alternatively, press Shift + Enter to execute the code block. This will run the block where your cursor is currently placed.
-
Similarly, run each subsequent cell block step-by-step till the end.
-
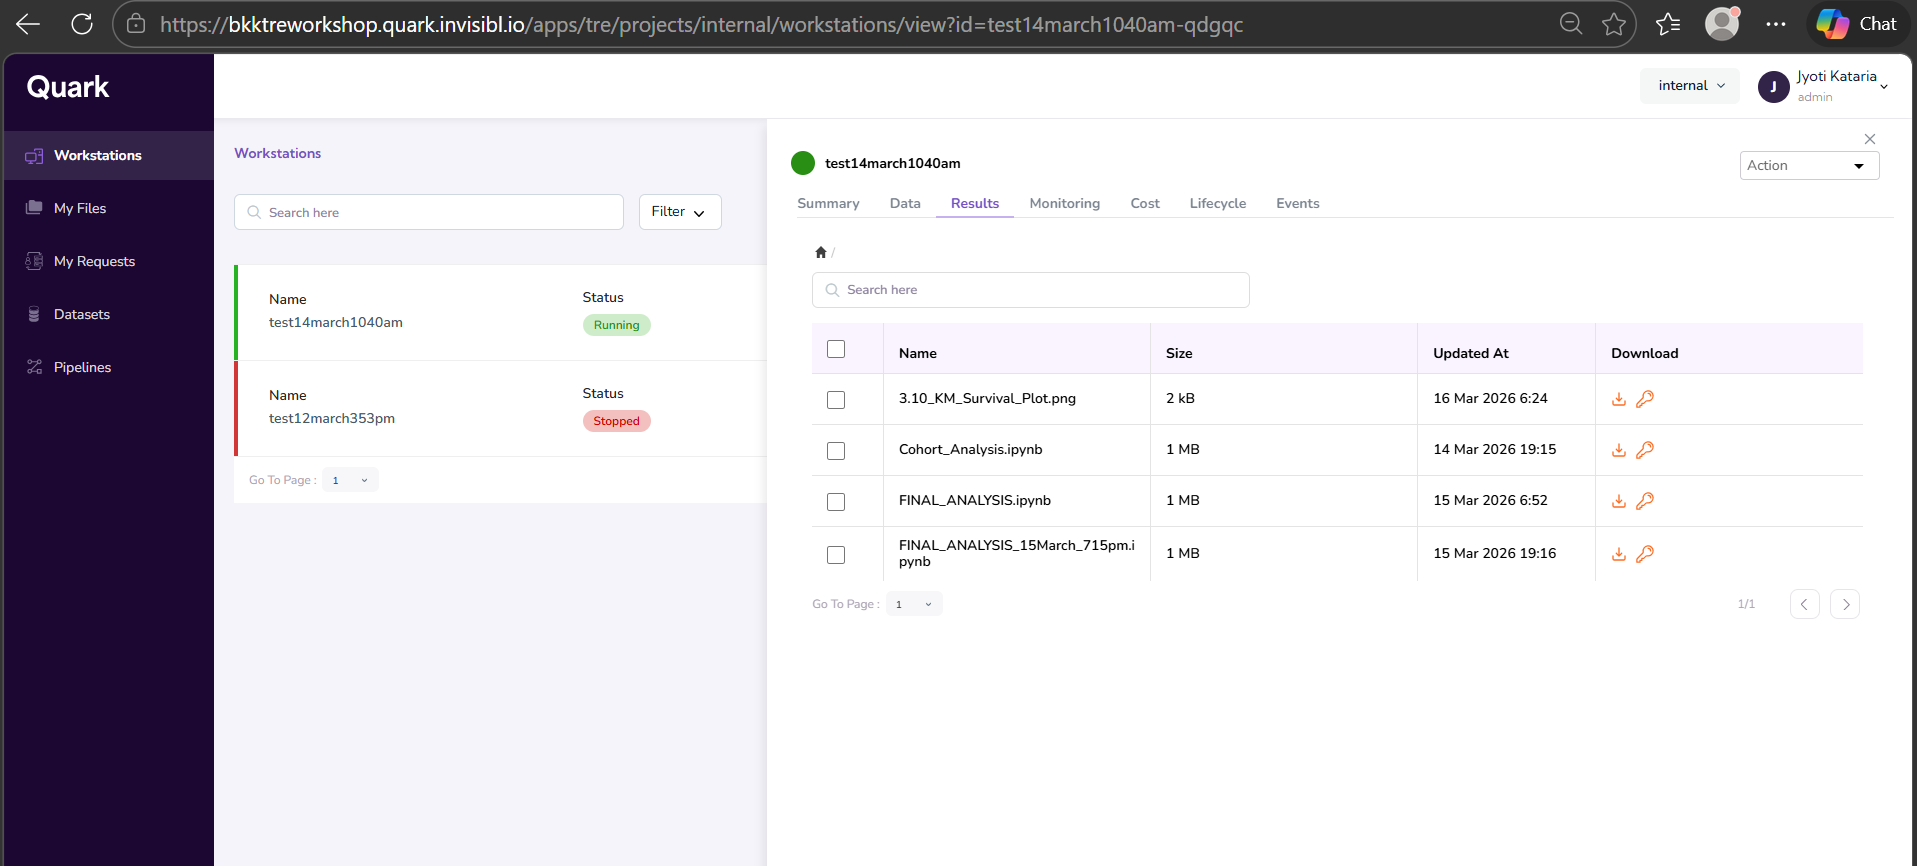
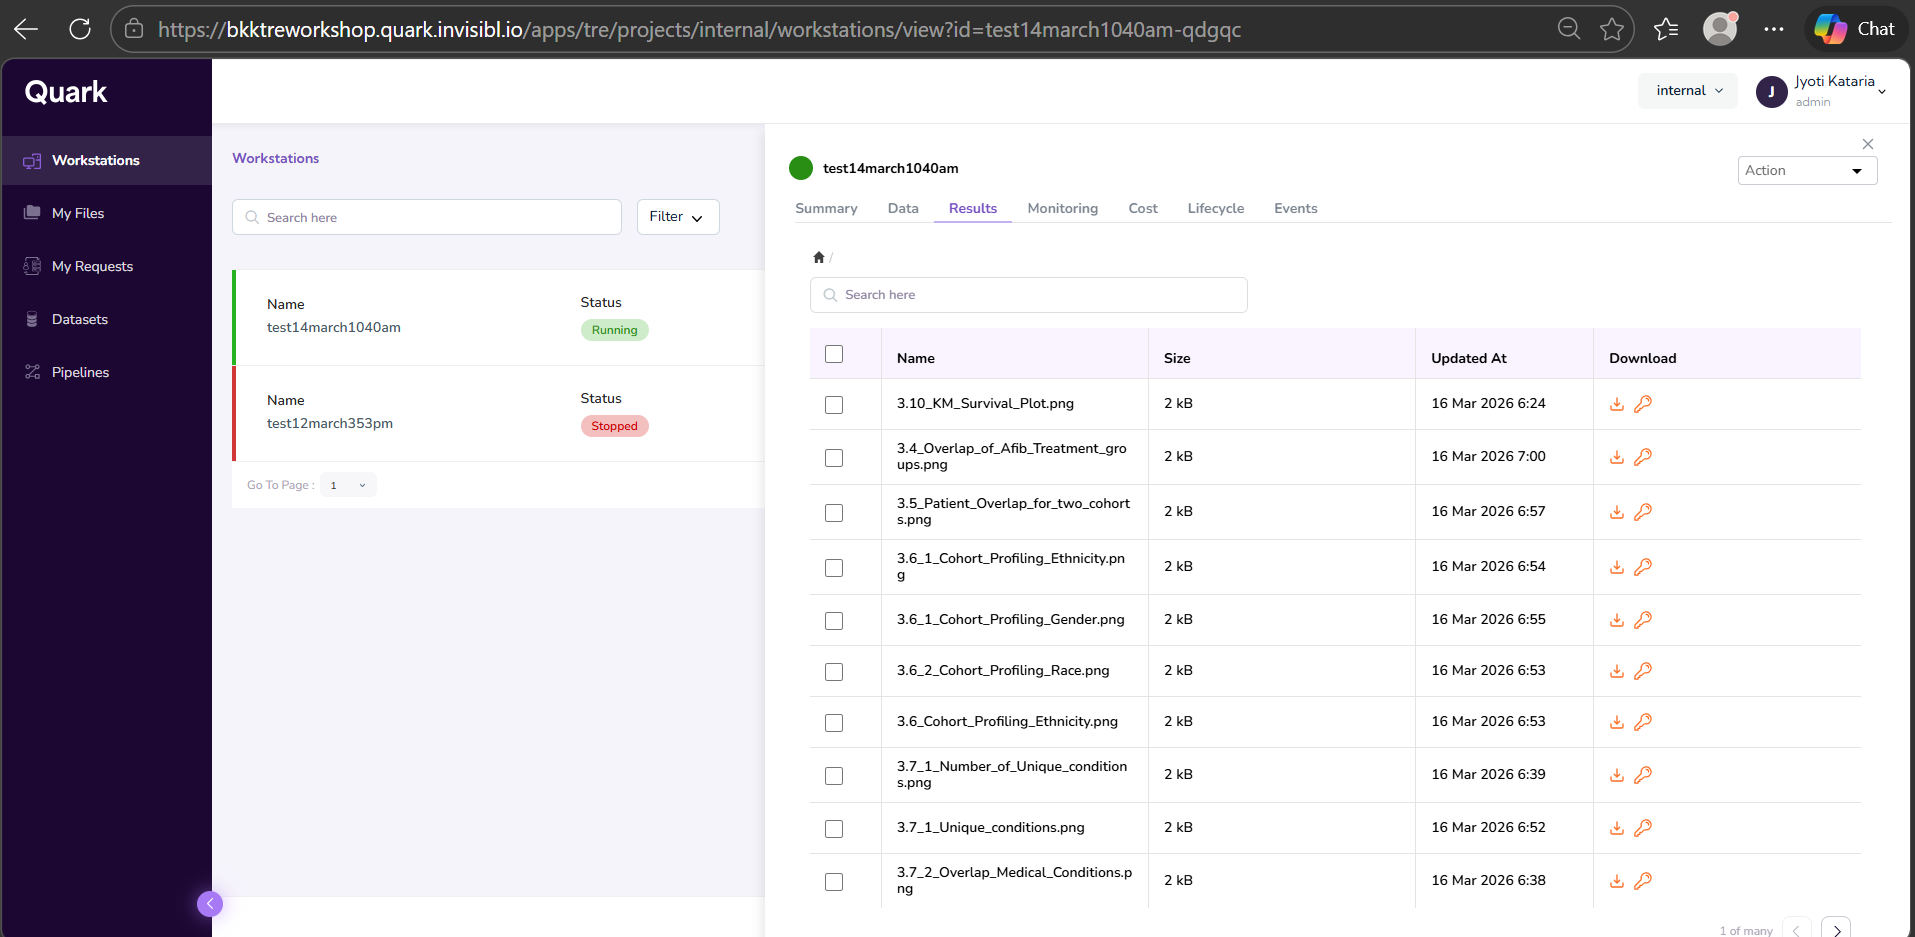
Once completed, you can view the output files for your run analysis as shown below.
Step 10: Request Download of Result Files
In this final step, you will be able to download
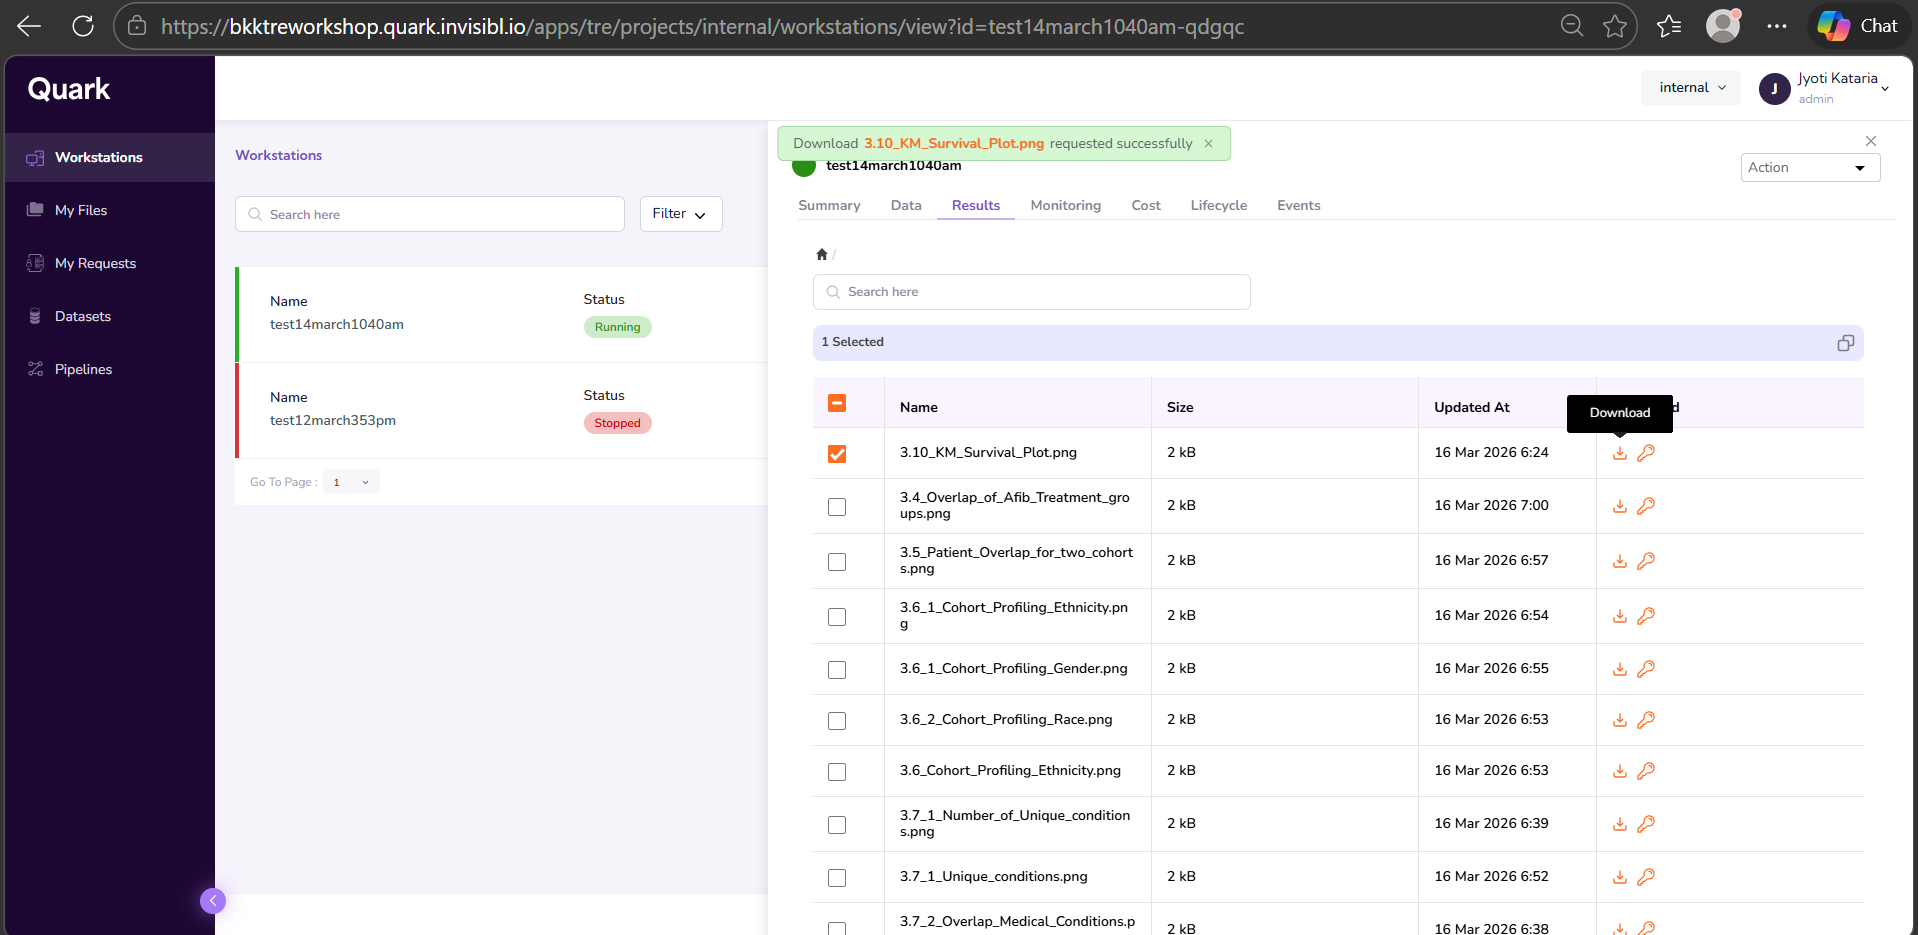
- Open the Workstations window and click on the workstation that was used to run the analysis. In the right-hand pop-up pane, select the Results tab. Your output file will be listed there. Click the Download icon in the last column of the corresponding row to download the file.
- You will see a notification pop-up on the top of the screen, notifying you that your download request has been successfully sent to the Admin.
- Once you’ve received the notification shown in the above screenshot, click on “My Requests” in the navigation pane to the left to check the status of your requested file.
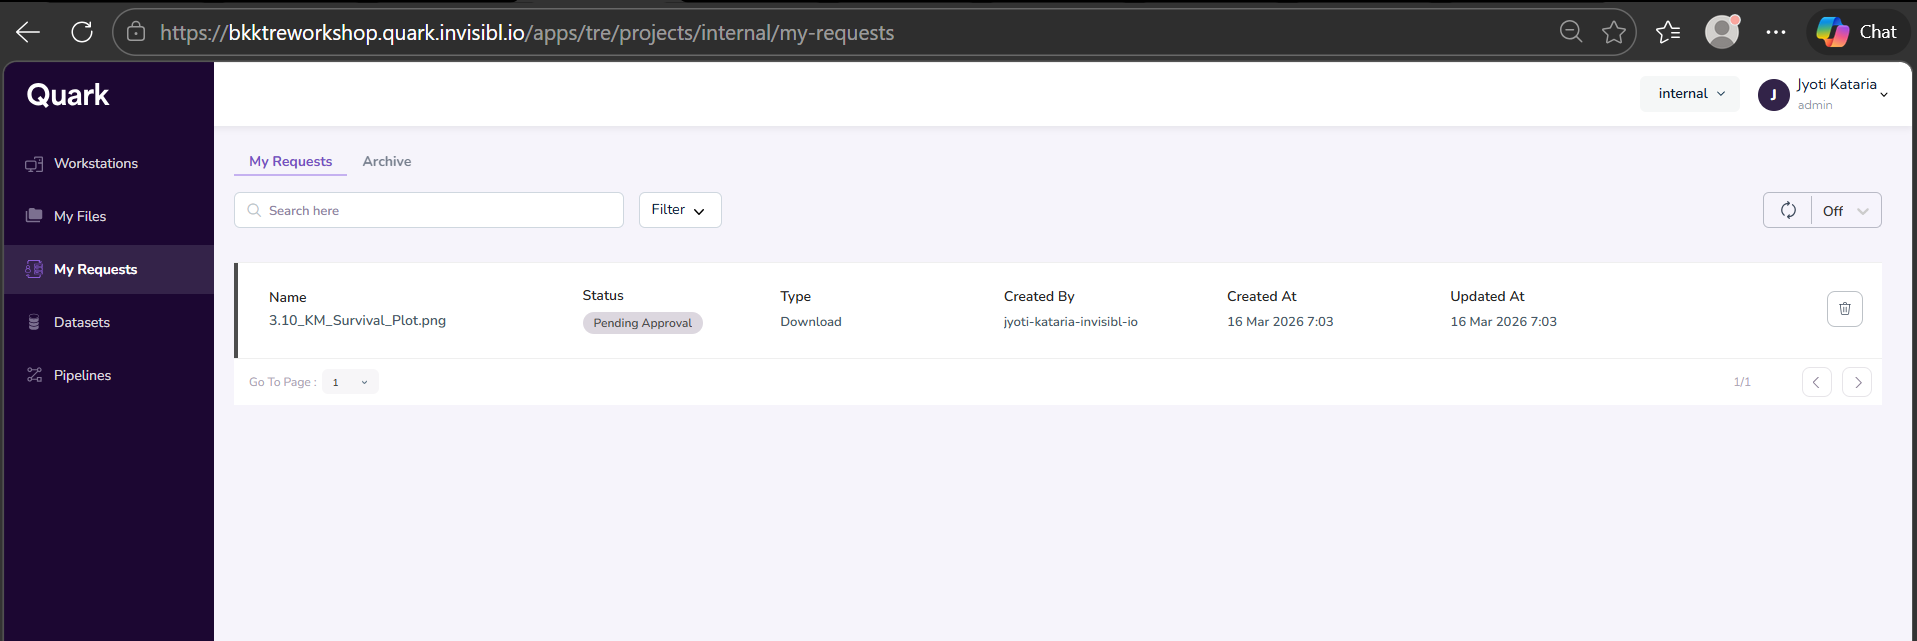
- You will see your requested download file “Pending Approval.”
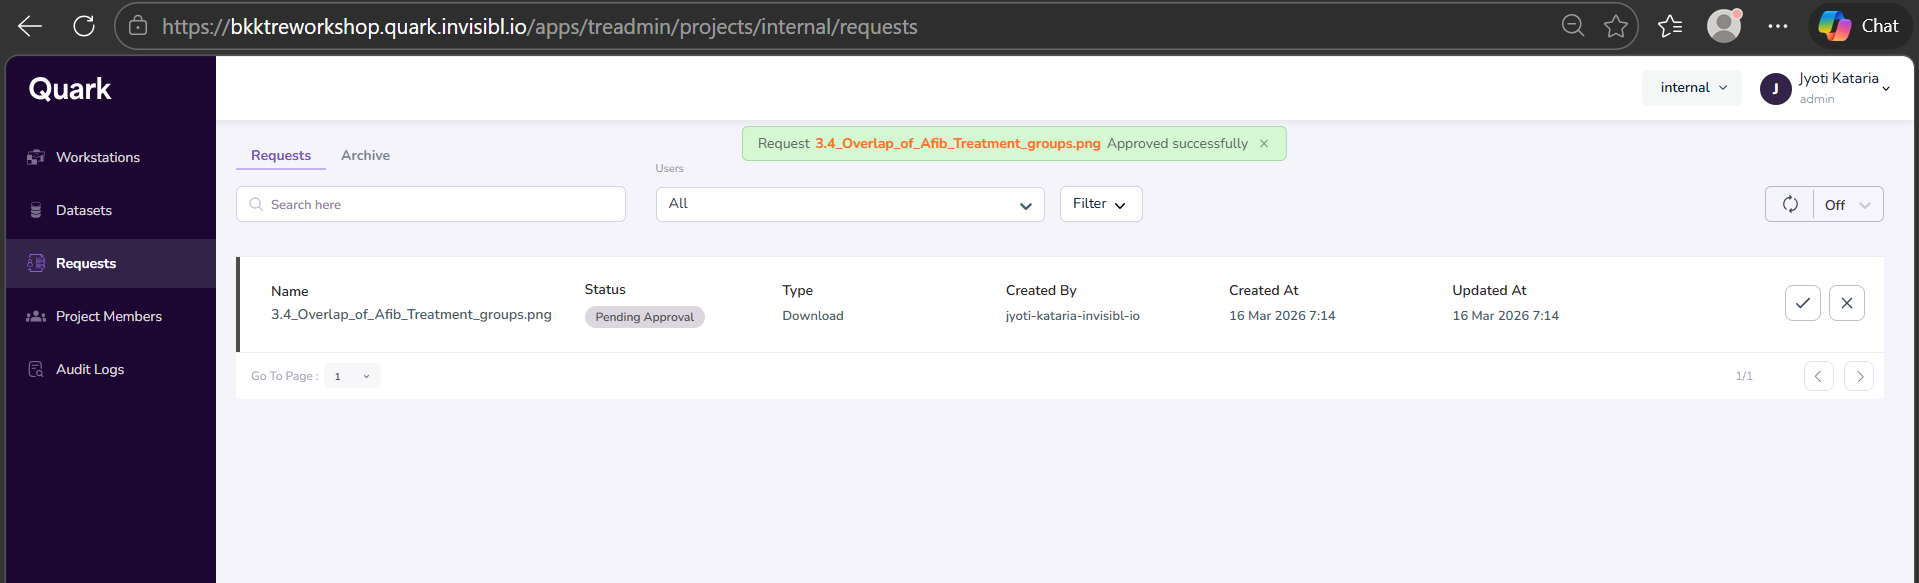
- The approval flow can be completed by the TRE Admin. [j]
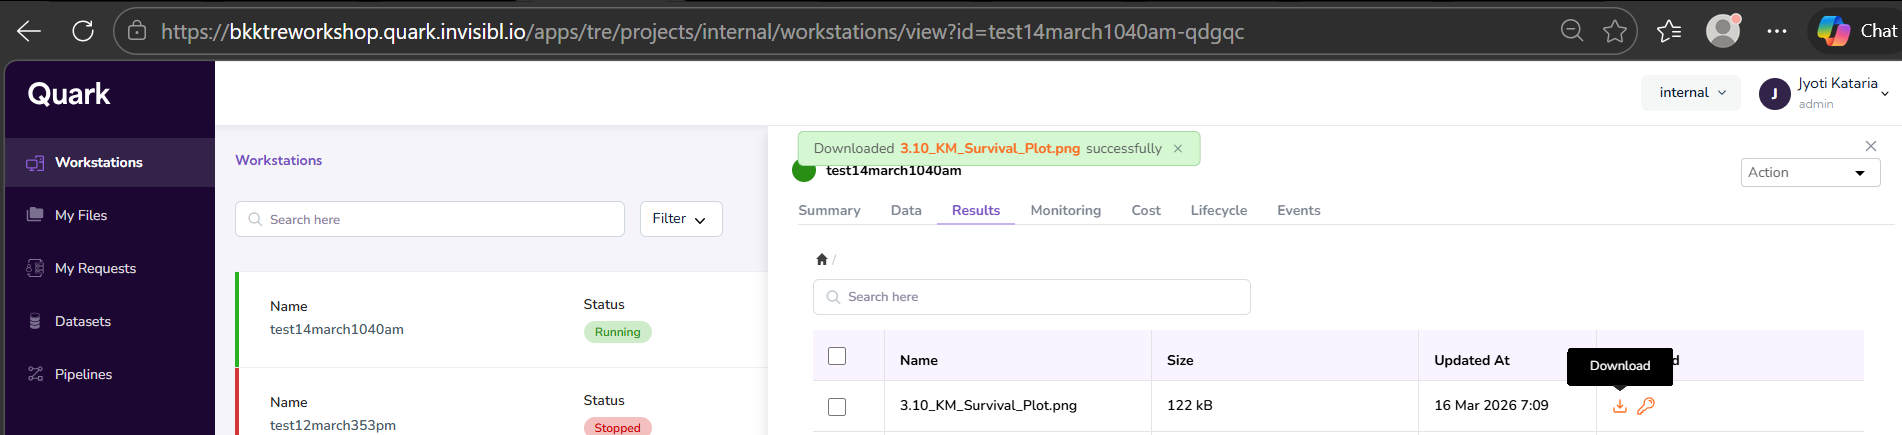
- Once your download request is approved, you will get a notification as shown below.
- Click on “Workstations” in the navigation pane on the left, and select your workstation. Again, click on the “Results” tab, and click the download button again. Your download will initiate instantly.
Feedback
Link: https://forms.gle/eAMDPv78KR4CjCU37
QR: